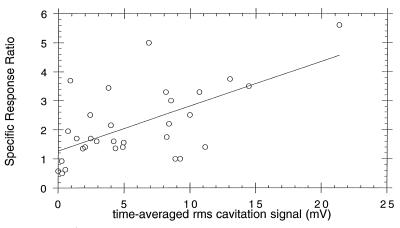
FIG. 2.
Specific response ratio plotted versus time-averaged RMS cavitational signal (in millivolts) for all exposures in this study. Data shown are for individual experiments, not group means. Specific response ratio is defined as the ratio of the maximum RLU per viable cell for ultrasound-exposed bacteria to the maximum RLU per viable cell for sham-exposed controls. RMS signal from the 20-MHz passive cavitation detector is a measure of average acoustic emissions produced by collapsing bubbles occurring throughout the 5-min insonification.

