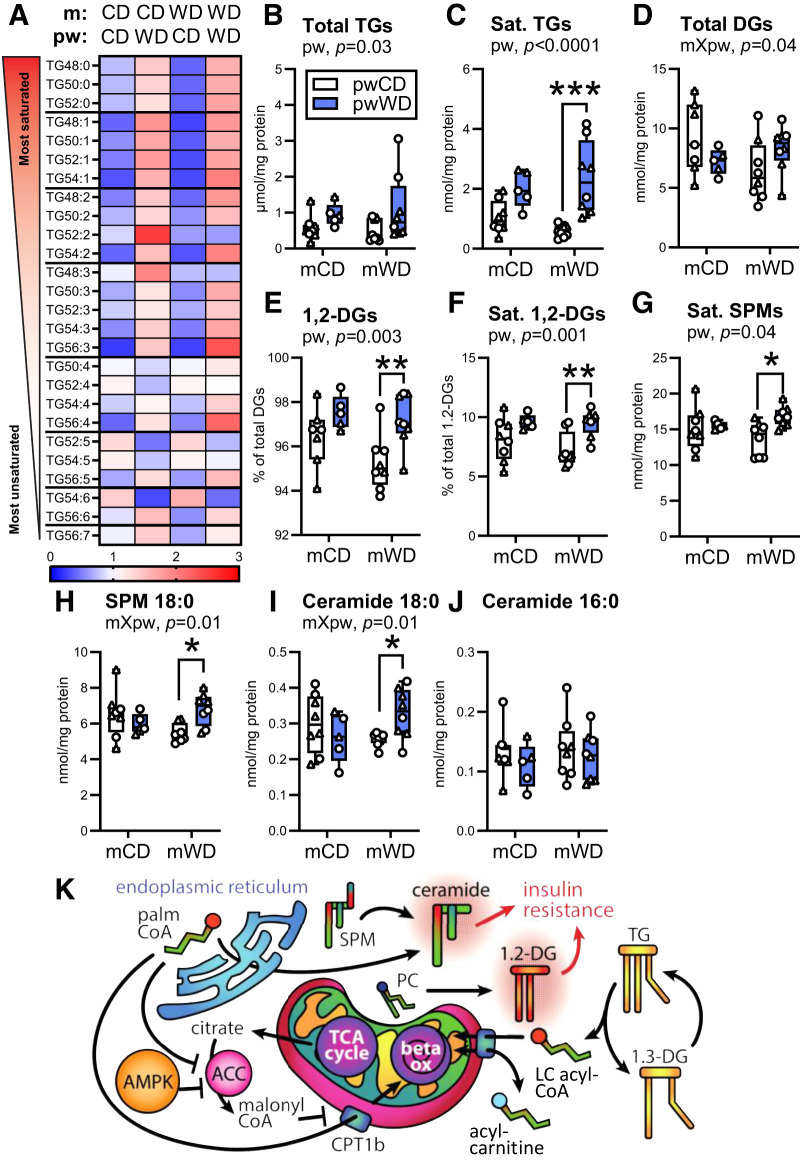
Figure 5.
Measurement of intramuscular lipids in offspring skeletal muscle. Saturated TG species (A), total TG content (B) and saturated (Sat.) TG abundance (C) were measured in gastroc of 3Y offspring. DG abundance (D), percent of 1,2-DGs of total DGs (E), percent of saturated 1,2-DGs out of total 1,2-DGs (F), saturated SPM abundance (G), 18:0 SPM (H), 18:0 ceramide (I), and 16:0 ceramide (J) content were also measured in the same samples. Data were analyzed with two-way ANOVA with Sidak multiple comparisons test. P values for significant effects are listed in each graph. For post hoc analysis, asterisks (*P < 0.05, **P < 0.01, ***P < 0.001) indicate significant differences between pw diets within the same m diet group. Individual data points for offspring with minimum, maximum, and median and interquartile range per group are shown. M offspring are indicated by circles and F offspring by triangles. Sample size for each group by sex: mCD/pwCD, 5 F/3 M; mCD/pwWD, 2 F/3 M; mWD/pwCD, 2 F/6 M; mWD/pwWD, 5 F/3 M. K: An illustration summarizing offspring intramuscular lipid metabolism. TG, triacylglyceride; DG, diacylglyceride; palmCoA, palmitoyl CoA; PC, phosphatidylcholine; SPM, sphingomyelin; beta ox, beta oxidation; LC, long chain; TCA, tricarboxylic acid; Sat., saturated.

