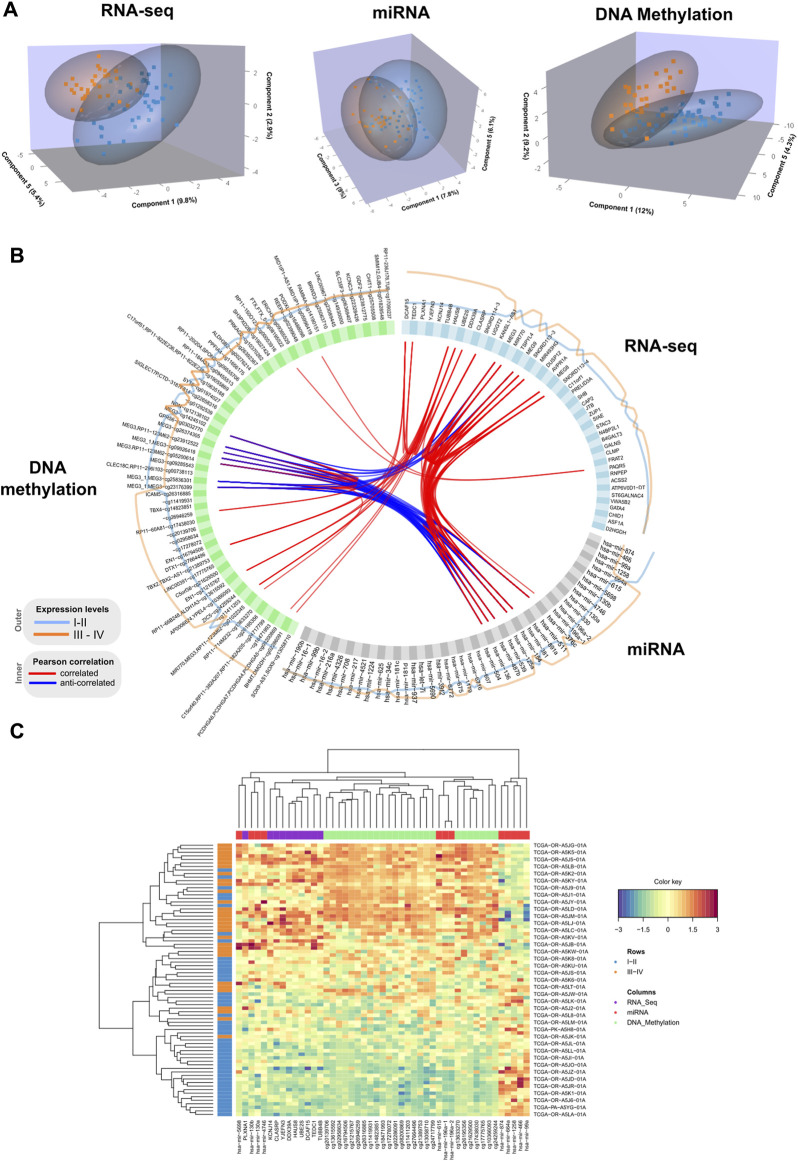
FIGURE 1.
(A) 3D samples plots for RNA-Seq, micro RNA and DNA methylation data. For each OMICs dataset, samples are projected into the space spanned by the three components explaining most of the variance. Disease stage is represented with different colors. (B). Circos plot representing correlations among features from different data types. Only variables with absolute correlations higher than 0.75 are shown. Outer lines represent the expression levels for each variable from the two different stage groups. (C). Clustered heatmap using variables included in the component 1 from the multiblock sPLS-DA model. Samples are represented in rows, and features from different data type are represented in columns. Euclidean distance and Complete linkage methods are used for clustering. The standardized abundance level is shown by the color key.

