

Abstract
In theoretical chemistry, topological indices are commonly employed to model the physico-chemical properties of chemical compounds. Mathematicians frequently use Zagreb indices to calculate a chemical compound's strain energy, melting point, boiling temperature, distortion, and stability. The current global pandemic caused by the new SARS-CoV-2, also known as COVID-19, is a significant public health concern. Various therapy modalities are advised. The issue has become worse since there hasn't been enough counseling. Researchers are looking at compounds that might be used as SARS and MERS therapies based on earlier studies. In several quantitative structure-property-activity relationships (QSPR and QSAR) studies, a variety of physiochemical properties are successfully represented by topological indices, a sort of molecular descriptor that just specifies numerical values connected to a substance's molecular structure. This study investigates several irregularity-based topological indices for various antiviral medicines, depending on the degree of irregularity. In order to evaluate the effectiveness of the generated topological indices, a QSPR was also carried out using the indicated pharmaceuticals, the various topological indices, and the various physiochemical features of these antiviral medicines. The acquired results show a substantial association between the topological indices being studied by the curve-fitting approach and the physiochemical properties of possible antiviral medicines.
Keywords: Irregularity indices, Antiviral drugs, Edge partition, Topological indices, Graph polynomials
List of Abbreviations
- QSPR
quantitative structure–property relationships
- QSAR
quantitative structure–activity relationships
- PHEIC
Public Health Emergency of International Concern
- WHO
World Health Organization
- CT(Scan)
Computed Tomography Scan
- GLOPID-R
Global Research Collaborative on Infectious Disease Preparedness
- M1
First Zagreb
- M2
Second Zagreb
Degree vertices of x
Degree vertices of y
- BP
Boiling Point
- MV
Molar volume
- FP
Flash point
- T
Surface Tension
- PSA
Polar Surface Area
- P
Polarizability
1. Introduction
The SARS-CoV-2 virus strain is the source of the infectious disease coronavirus disease 2019 (COVID-19), which is also known as COVID-19 [1]. In 2019, in Wuhan, China, the first COVID-19 case was reported. Since then, instances have spread internationally, causing the coronavirus pandemic crisis between 2019 and 2020 [2]. In the spectrum of identified cases, there will be four deaths up until March 2020, according to [3]. The 2019–2020 coronavirus outbreak has been declared a pandemic and a Public Health Emergency of International Concern (PHEIC) by the World Health Organisation (WHO) [4]. In many countries throughout each of the six WHO regions, there is proof of close disease transmission. Infected people frequently have symptoms including fever, coughing, and shortness of breath; however, less often seen symptoms include muscular discomfort, sputum production, and raw throat. While most instances have mild symptoms, some develop severe pneumonia and multi-organ failure [5]. According to [6], the virus frequently spreads from one person to another by respiratory droplets made while coughing and sneezing. Typically, it takes 2 to 14 days from exposure to the start of symptoms, with a mean of 5 days [7]. A chest computed tomography scan (CT scan) that shows potential respiratory diseases can be used to detect the infection in addition to a combination of symptoms, risk factors, and these tests. For persons who are suspected of having the virus and their caretakers, but not for the general public, suggested infection prevention methods include regular hand washing, social withdrawal, keeping hands away from the face, and mask-wearing [8]. Coronavirus is not currently being treated with a vaccine or any specialized antiviral medications. However, management includes symptom therapy, follow-up care, seclusion, and experimental methods.
Comparing existing experimental data on topological indices can be a complex task, as it depends on the specific indices being considered, the types of molecules or structures they are applied to, and the sources of data available. Topological indices are mathematical descriptors that provide information about the structure of molecules or networks, and they can have various applications in chemistry, biology, and materials science. Some common topological indices include the Wiener index, the Randic index, and the Zagreb indices, among others. For this, we observed select molecules or structures, collected experimental data, calculated topological indices, performed statistical analysis, etc. The COVID-19 pandemic poses a serious threat to the global public health infrastructure. The whole community became more aware of the worst-case possibilities as the number of instances, patients, and fatalities increased globally. In order to combat the COVID-19 pandemic, the medical and scientific communities are working together to collect the most up-to-date information available through diagnosis, treatment, and management procedures. The COVID-19 Study Roadmap was created in January 2020 by the WHO in collaboration with the Global Research Collaborative on Infectious Disease Preparedness (GLOPID-R) (www.glopid-r.org). There is no established plan for treating COVID-19 individuals, despite awareness of the SARS-CoV-2 infectious cycle. In the meantime, researchers from all around the world are working hard to develop therapeutic medicines or vaccines against viruses. Numerous novel medications that have shown antiviral activity against SARS-CoV-2 were studied in the study based on current scientific findings and recommendations. Every year, chemical laboratories produce a sizeable fraction of new pharmaceuticals and medicines that are then released into the market following research trials. In order to determine their toxicity, side effects, and biological activity on the human body, several tests and studies are first required. For nations with limited resources, testing these medications would be exceedingly expensive and would require expensive laboratories. Researchers studied a sizable number of chemical compounds and examined their molecular structures to draw conclusions about the qualities of drugs. Numerous scientific research studies have shown a substantial correlation between the qualities of medications or treatments and their molecular structure. Drugs' medicinal qualities can be derived by applying chemical graph theory [19], [21], [44] to the molecular structure of the relevant medication. Chemical graph theory is a branch of mathematical chemistry that integrates math, chemistry, and graph theory to quantitatively resolve chemistry-related problems [9], [10], [11]. A topological index is a type of molecular descriptor that is commonly used in quantitative structure-property/activity relationship (QSPR/QSAR) studies. It is an efficient way to model many physicochemical properties by simply defining numerical values associated with the molecular structure of a compound [25], [12], [27], [13]. The further study on this subject were presented in [29], [14], [15], [34]. Further discussed in this paper is an analysis of the topological indices provided above using QSPR. We demonstrate, using the polynomial regression approach, that the obtained attributes are significantly related to the properties of COVID-19 antiviral medications.
Applications of molecular descriptors in chemistry:
Molecular descriptors, also known as molecular indices or molecular features, are numerical representations that capture various properties and characteristics of molecules [30], [31]. These descriptors play a significant role in a wide range of applications in chemistry, bioinformatics, drug discovery, materials science, and other fields. Here are some common applications of molecular descriptors:
-
(i)
Quantitative Structure-Activity Relationship (QSAR) Studies: Molecular descriptors are used in QSAR studies to establish relationships between the chemical structure of a molecule and its biological activity. This is valuable in drug design, predicting biological effects, and understanding molecular interactions.
-
(ii)
Drug Design and Discovery: Molecular descriptors help in designing new drug candidates by predicting their properties, such as solubility, bioavailability, toxicity, and binding affinity to target proteins. These predictions aid in selecting promising candidates for further development.
-
(iii)
Virtual Screening: Molecular descriptors are employed in virtual screening processes to prioritize compounds from large chemical libraries. Descriptors can be used to filter out molecules that are less likely to be successful drug candidates.
-
(iv)
Quantitative Structure-Property Relationship (QSPR) Studies: Similar to QSAR, QSPR involves using molecular descriptors to establish relationships between molecular structure and physical or chemical properties, such as boiling point, melting point, refractive index, and more.
-
(v)
Material Design and Discovery: Molecular descriptors are used in materials science to predict properties of materials, such as electronic properties, conductance, and thermal stability. This aids in designing new materials with specific desired properties.
-
(vi)
Environmental Chemistry: Molecular descriptors can be used to predict the environmental behavior of molecules, such as their persistence, bioaccumulation, and potential toxicity.
-
(vii)
Cheminformatics and Bioinformatics: In cheminformatics and bioinformatics, molecular descriptors are used for data analysis, similarity searching, clustering, and classification of compounds.
-
(viii)
Toxicity Prediction: Molecular descriptors contribute to toxicity prediction models, helping to identify potential hazardous compounds and prioritize safety assessments.
-
(ix)
Quantum Chemistry and Computational Chemistry: Molecular descriptors are sometimes used as input features for quantum chemical calculations and molecular modeling, aiding in simulating molecular properties and behavior.
-
(x)
Analytical Chemistry: Molecular descriptors can be used to develop calibration models for analytical techniques like spectroscopy and chromatography.
-
(xi)
Molecular Visualization and Communication: Descriptors can be used to visualize and communicate molecular properties in a simplified form to researchers, making complex molecular information more accessible.
-
(xii)
Machine Learning and Data Mining: Molecular descriptors serve as input features for machine learning algorithms, facilitating the development of predictive models and pattern recognition.
These are just a few examples of the diverse applications of molecular descriptors. Their versatility and ability to capture essential molecular information make them fundamental tools in various scientific and industrial domains.
2. Graph-theoretical preliminaries
The graph theory concepts that must be understood in order to establish the conclusions in the next parts are listed in this section, [38], [39]. These definitions might be used to create reliable machine learning and artificial intelligence techniques for a vast combinatorial library of medications. A molecular graph is a straightforward graph in which the vertices and edges represent, respectively, the atoms and bonds of the substance. Allow G to stand for a graph with a set of vertices whose cardinality is α and subsets of two elements called the edges constituting , whose cardinality equals the size β, of . In 1975, Gutman provided the concept of Zagreb indices, and they have given the definition of the first and second Zagreb indices, which are defined as
and , where and are degrees of vertices x and y in G, respectively.
If specific criteria are satisfied, topological indices are regarded as irregularity indices. The topological indices of a graph must first be larger than or equal to zero. Second, if a graph's topological indices are equal to zero, it is assumed that the graph is regular. The irregularity indices of a connected graph G with α vertices and β edges are defined as follows;
-
1.
-
2.
-
3.
-
4.
-
5.
-
6.
-
7.
-
8.
-
9.
-
10.
-
11.
-
12.
-
13.
-
14.
-
15.
-
16.
3. Methodology and main results
The formulae for the relevant irregularity indices of the molecular graphs of the eight antiviral medications used in the treatment of COVID-19 are derived in this section using combinatorial computing, edge partitioning, and degree counting. First, we establish the sixteen irregularity indices of the Lopinavir molecular graph.
3.1. Clinically used drugs
Being a virus that spreads quickly, SARS-CoV-2, it is essential to treat people who are affected as soon as possible. Here is a list of some of the most popular medicines.
-
1.
Lopinavir/Ritonavir
Lopinavir (see Fig. 1) is a protease inhibitor that specifically targets the HIV virus. The FDA approved it in 2000 after it was found in 1998. This drug inhibits proteolytic processing and blocks the generation of viral proteins by imitating the structure of a peptide that HIV protease has cut. This medication, when used with oseltamivir, another flu medication, was found to result in full recovery after exhibiting pneumonia-related COVID-19 symptoms [16], [17].
-
2.
Remidesivir (anti-viral peptide)
This drug (see Fig. 2), SARS-CoV, MERS-CoV, and Ebola have all been treated with an adenosine nucleotide association... In a recent study, Remidesivir scored 0.77M at half maximum dose against COVID-19 and halted the spread of viruses [18].
-
3.
Chloroquine
This anti-malarial medication has demonstrated potential as a method of treating influenza A vulvaris (Yan et al., 2013). The immune system is modulated by the antiviral medication chloroquine (see Fig. 3). By increasing the endosomal PH required for viral fusion, this drug prevented viral infection and showed 1.13M against SARS-CoV-2 at half the recommended dose [20].
-
4.
Hydroxychloroquine
Its antiviral properties are extremely comparable to those of chloroquine. (see Fig. 4). Both have immune-modifying qualities that may improve their in vivo antiviral effects. According to a Forbes article dated March 30, 2020, the FDA has approved hydroxylchloroquine as an urgent coronavirus therapy. By preventing T cell activation, hydroxychloroquine reduces the cytokine storm and decreases the initial course of COVID-19 [22].
-
5.
Theaflavin
It is a molecule of polyphenol (see Fig. 5) found in that has been connected to the advantages associated with consuming black tea and has demonstrated antiviral activity against several viruses, including influenza A, B, and C [23], [24].
-
6.
Arbidol
With signs of effectiveness against severe acute respiratory syndrome in vitro, arbidol, a conventional antiviral drug, is becoming more popular as a COVID-19 therapy, see Fig. 6.
-
7.
Thalidomide
A potential drug for the treatment of COVID-19 patients with severe symptoms is thalidomide (see Fig. 7). The patient's oxygen index was rapidly improved, and combining 100 mg of thalidomide with a little dose of methylprednisolone allowed for the management of the development of any adverse effects. [26], [28], [32].
Figure 1.

Molecular structure of Lopinavir/Ritonavir (C37H48N4O5)
Figure 2.

Molecular structure of Remidesivir (C27H35N6O8P)
Figure 3.

Molecular structure of Chloroquine (C18H26ClN3)
Figure 4.
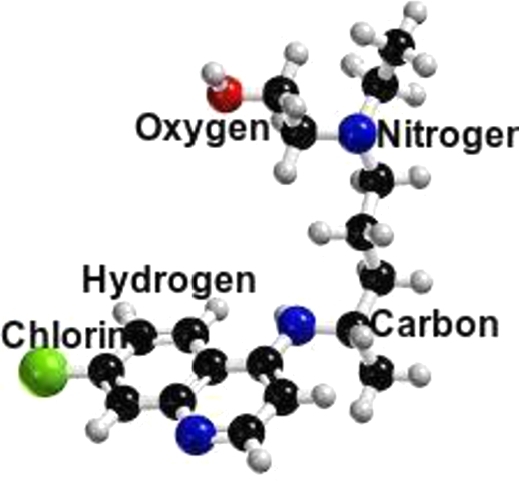
Molecular structure of Hydroxychloroquine (C18H26ClN3O)
Figure 5.
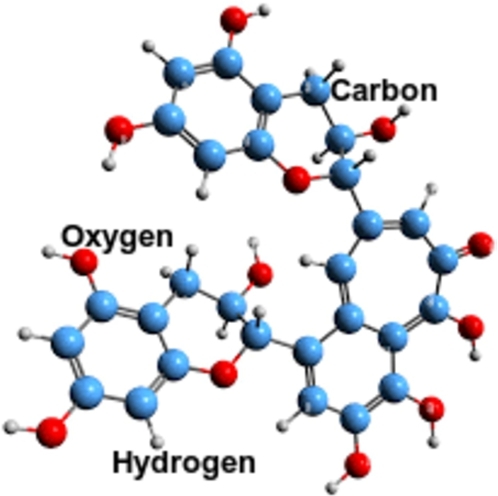
Molecular structure of Theaflavin (C29H24O12)
Figure 6.
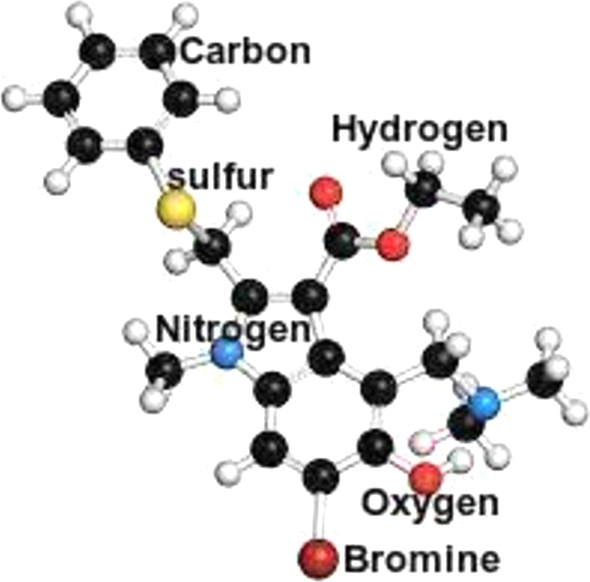
Molecular structure of Arbidol(C22H25BrN2O3S)
Figure 7.

Molecular structure of Arbidol(C13H10N2O4)
Result and Method.
Let L be a molecular graph of Lopinavir (see Fig. 8 and Fig. 9) with vertices and edges. By the structure analysis of L, we have the following Table 1.
Figure 8.

The chemical structures of COVID-19 drugs
Figure 9.

The chemical structures of Lopinavir and Ritonavir
Table 1.
Partition of edge set of molecular graph of Lopinavir.
| Edge Partition (μL(x),μL(y)) | (1,3) | (2,2) | (2,3) | (3,3) |
|---|---|---|---|---|
| Frequency | 8 | 14 | 20 | 7 |
By the definitions of irregularity indices, we obtain;
Next we obtain the irregularity indices of Ritonavir.
Let G be a Ritonavir's molecular graph (see Fig. 1) with 50 vertices and 53 edges, that is, and as determined by its structure [33], [35], [36]. By the structure analysis of G, we have the following Table 2.
Table 2.
Partition of edge set of molecular graph of Ritonavir.
| Edge Partition (μG(x),μG(y)) | (1,3) | (2,2) | (2,3) | (3,3) |
|---|---|---|---|---|
| Frequency | 9 | 13 | 26 | 5 |
By the definitions of irregularity indices, we obtain;
Table 3 shows that the edge partitions of vertex degrees for the molecular graphs of the proposed drugs given in Fig. 1.
Table 3.
Partition of edge set of some molecular graphs.
| (μ(x),μ(y)) | Arbidol | Thalidomide | Remsesivir | Chloroquine | H-chloroquine | Theaflavin |
|---|---|---|---|---|---|---|
| (1,2) | 1 | - | 2 | 2 | 2 | - |
| (1,3) | 6 | 4 | 5 | 2 | 2 | 10 |
| (1,4) | - | - | 2 | - | - | - |
| (2,2) | 6 | 4 | 9 | 5 | 6 | - |
| (2,3) | 9 | 6 | 14 | 12 | 12 | 22 |
| (2,4) | - | - | 4 | - | - | - |
| (3,3) | 9 | 7 | 6 | 2 | 2 | 14 |
| (3,4) | - | - | 2 | - | - | - |
| Total Frequency | 31 | 21 | 44 | 23 | 24 | 46 |
For all the drugs considered we now list the irregularity indices are derived as in the case of Lopinavir and Ritonavir. These are listed below in the follow table.
4. QSPR/QSAR analysis for anticovid drugs
This section's main objective is to develop a quantitative structure-property relationship (QSPR) between the various irregularity-based topological indices and particular physicochemical properties in Table 5 and graphically in Fig. 10 of the medications under investigation in order to evaluate the effectiveness of the topological indices [37], [40], [41]. In order to model antiviral activity using sixteen irregularity-based topological indices, eight representative physicochemical properties including boiling point (BP), enthalpy of vaporisation (E), flash point (FP), molar refraction (MR), polar surface area (PSA), polarizability (P), surface tension (T), and molar volume (MV) were used.
Table 5.
Physico-chemical properties of COVID-19 drugs.
| Drugs | BP | E | FP | MR | PSA | P | T | MV |
|---|---|---|---|---|---|---|---|---|
| Lopinavir | 924.2 | 1408 | 5127 | 1792 | 120 | 710 | 495 | 5405 |
| Ritonavir | 9470 | 1444 | 5266 | 1989 | 202 | 789 | 537 | 5817 |
| Arbidol | 5918 | 915 | 3117 | 1219 | 80 | 483 | 453 | 3473 |
| Thalidomide | 4878 | 794 | 2488 | 652 | 87 | 257 | 716 | 161 |
| Chloroquine | 4606 | 721 | 2323 | 974 | 28 | 386 | 440 | 2879 |
| Hydroxy-Chloroquine | 5167 | 830 | 2663 | 990 | 48 | 392 | 498 | 2854 |
| Theaflavin | 10039 | 1535 | 3365 | 1373 | 218 | 544 | 1386 | 3010 |
| Remdesivir | - | - | - | 1495 | 213 | 593 | 623 | 409 |
Figure 10.

Graphical representation of Physico-chemical properties of COVID-19 drugs
We list the measured values of the irregularity-based topological indices for the COVID-19 medications derived in Table 4. The physicochemical properties of the proposed drugs are listed in Table 5. For each plot, we performed polynomial fitting in order to generate an equation. Table 6 shows the adj. value for each plot. For boiling point, enthalpy, FP, MR, PSA, and P, it can be shown that the VAR descriptor has the best value (that is, adj. is closest to 1), respectively [42], [43]. The highest value of adj. ensures the best fit for the data, and, as a result, the equation produced from it has the least amount of inaccuracy. For T, the VAR and descriptors are higher predictions and have the best adj. values, which are close to 1. Finally, for the property Molar Volume (MV), the , and are the suitable predictors that have the higher adj. values close to 1. Among these, IRL is the best-suited predictor for molar volume.
Table 4.
Topological descriptors and their values of molecular graphs of the drugs.
| TDs | Lopinavir | Ritonavir | Arbidol | Thalidomide | Chloroquine | H-Chloroquine | Theaflavin | Remdesivir |
|---|---|---|---|---|---|---|---|---|
| VAR | 0.4614 | 0.4656 | 0.6018 | 0.5874 | 0.6617 | 0.4464 | 0.4275 | 0.6722 |
| AL | 36 | 44 | 22 | 14 | 42 | 18 | 18 | 42 |
| IR1 | 88 | 96.24 | 71.315 | 46.108 | 122.3992 | 40.3646 | 40.441 | 112.9274 |
| IR2 | 0.1508 | 0.0735 | 0.265 | 0.2487 | 0.2705 | 0.1932 | 0.1861 | 0.2583 |
| IRF | 68 | 112 | 34 | 22 | 72 | 22 | 22 | 62 |
| IRFW | 0.2666 | 0.4392 | 0.1899 | 0.1732 | 0.2801 | 0.1833 | 0.1774 | 0.2153 |
| IRA | 1.7658 | 2.0454 | 7.0826 | 0.8154 | 1.984 | 7.0644 | 0.7312 | 0.2153 |
| IRB | 6.308 | 122.0866 | 4.2966 | 2.75 | 7.954 | 34.6272 | 2.6272 | 2.1566 |
| IRC | 0.1522 | 0.9322 | 0.2121 | 0.2002 | 0.2178 | 0.5397 | 0.15 | 0.2172 |
| IRDIF | 3.7999 | 45.6666 | 57 | 15.6666 | 42.6666 | 18.3333 | 18.3333 | 20.9999 |
| IRL | 16.8988 | 20.4304 | 10.9342 | 6.8274 | 18.677 | 8.4494 | 8.4494 | 19.907 |
| IRLU | 26 | 31 | 17.5 | 11 | 29.6666 | 12 | 12 | 31 |
| IRLF | 17.4028 | 21.007 | 11.3097 | 7.0684 | 19.3091 | 8.6226 | 8.6226 | 20.5287 |
| IRLA | 16 | 94.09 | 5.4666 | 6.4 | 20.238 | 7.1332 | 7.1332 | 18.8 |
| IRD1 | 22.6508 | 27.908 | 7.5226 | 8.553 | 16.8186 | 11.9006 | 11.9006 | 26.2342 |
| IRGA | 1.5584 | 1.8246 | 1.1053 | 0.6976 | 1.8248 | 06502 | 06502 | 1.8868 |
Table 6.
The adj R2 values for the fitted curve of topological descriptors against the properties of COVID-19 drugs.
| Topological descriptors | BP | E | FP | MR | PSA | P | T | MV |
|---|---|---|---|---|---|---|---|---|
| VAR | 0.9761 | 0.979 | 0.976 | 0.9973 | 0.9105 | 0.9974 | 0.9991 | 0.994 |
| AL | - | - | 0.6499 | 0.6486 | - | 0.649 | - | 0.874 |
| IR1 | - | 0.6177 | 0.9538 | 0.8571 | - | 0.857 | - | 0.9956 |
| IR2 | - | - | 0.6264 | 0.8676 | 0.6283 | 0.8663 | 0.999 | 0.8668 |
| IRF | - | - | 0.9488 | - | - | - | - | 0.8009 |
| IRFW | - | 0.6376 | 0.93 | 0.6678 | - | 0.6672 | - | 0.9388 |
| IRA | - | - | - | - | - | - | 0.9875 | - |
| IRB | - | - | - | - | - | - | - | 0.8498 |
| IRC | 0.681 | 0.6591 | - | - | - | 0.9788 | 0.726 | - |
| IRDIF | - | - | 0.9561 | 0.8761 | - | 0.8765 | - | 0.9969 |
| IRL | - | - | 0.9561 | 0.8342 | - | 0.8347 | - | 0.9969 |
| IRLU | - | - | - | 0.6716 | - | 0.6712 | - | 0.7458 |
| IRLF | - | - | 0.9561 | 0.8554 | - | 0.8558 | - | 0.9955 |
| IRLA | 0.63 | 0.6655 | 0.969 | 0.8145 | - | 0.815 | - | 0.9965 |
| IRD1 | - | - | 0.9561 | 0.8151 | - | 0.8156 | - | 0.9969 |
| IRGA | - | - | - | - | - | - | - | - |
The equation obtained between BP vs VAR is as follows;
| (1) |
The equation obtained between E vs VAR is as follows;
| (2) |
The equation obtained between FP vs VAR is as follows;
| (3) |
The equation obtained between MR vs VAR is as follows;
| (4) |
The equation obtained between PSA vs VAR is as follows;
| (5) |
The equation obtained between P vs VAR is as follows;
| (6) |
The equations obtained between T vs VAR and T vs are as follows;
| (7) |
| (8) |
The equations obtained between MV vs , MV vs IRL and MV vs are as follows;
| (9) |
| (10) |
| (11) |
It was discovered that has a good association with the estimated 50% inhibitory concentration IC50 values after the polynomial regression models were briefly applied to the inhibitor and suggested index.
| (12) |
The polynomial model (12) of the index and the 50% inhibitory concentration IC50 values is presented in Fig. 13. For the studied medicines, Table 7 displays the observed IC50 from model (12) together with the anticipated activity estimated using the curve fitting model.
Figure 13.

Scatter plot between IR2 and IC50.
Table 7.
Drugs for COVID with predicted and experimental IC50 values.
| Drugs | IC50(μ M) | Predicted IC50 using model (12) | Residual |
|---|---|---|---|
| Lopinavir | 5.25 | -138252764491.65 | 138252764496.9 |
| Ritonavir | 8.63 | -1784811742621.96 | 1784811742630.59 |
| Arbidol | 3.53 | -17322156839.6858 | 17322156843.2158 |
| Chloroquine | 1.38 | -98941339.29 | 98941340.67 |
| Hydroxy-Chloroquine | 0.72 | -1680665.58 | 1680666.3 |
| Theaflavin | 8.44 | -1592768014194.76 | 1592768014203.2 |
| Remdesivir | 0.98 | -12639764.28 | 12639765.27 |
5. Conclusion
Start by understanding the theoretical underpinnings of the topological index you're studying. Each index is based on specific mathematical relationships that reflect certain structural or connectivity aspects of molecules. Relate the index to the underlying chemical and physical properties it is expected to capture. For example, consider how the index might relate to molecular size, shape, branching, connectivity, or electronic properties. Our investigation of the suggested indices in Section 1 has shown us that Table 6 and Figures (Fig. 11 and Fig. 12) that
Figure 11.

Scatter plot between TIs and properties of the drugs
Figure 12.

Scatter plot of TIs against T and MV
• The properties and P can be predicted using only VAR index as the corresponding adj. values are 0.9761, 0.979, 0.976, 0.9973, 0.9105, and 0.9974, respectively. As a result, the VAR index is ideal for forecasting these six physical qualities.
• The property T can be predicted using VAR, and IRA indices as the corresponding adj. values are 0.9991, 0.999, and 0.9875, respectively. We can see that both VAR and are the best-suited predictors for T.
• For the property MV can be predicted using VAR, and indices as the corresponding adj. values are 0.994, 0.9956, 0.9388, 0.9969, 0.9969, 0.9955, 0.9965, and 0.9965, respectively. We can observe that the IRL and are the best-suited predictors for MV. The physical interpretation of topological indices can provide insights into various properties and behaviors of molecules, networks, or structures.
Funding Statement
This research is supported by United Arab Emirates University (UAEU), Al Ain, UAE via Grant No. G00003739.
CRediT authorship contribution statement
Muhammad Usman Ghani: Writing – original draft. Muhammad Imran: Funding acquisition, Project administration, Validation, Writing – review & editing. S. Sampathkumar: Conceptualization, Validation. Fairouz Tchier: Data curation, Visualization. K. Pattabiraman: Data curation, Software. Ahmad Zubair Jan: Formal analysis, Investigation.
Declaration of Competing Interest
The authors declare that there is no conflict of interest regarding the publication of this article. All the authors of the paper have agreed to submit this paper. With best regards
Acknowledgement
Researchers Supporting Project number (RSP2023R401), King Saud University, Riyadh, Saudi Arabia.
Data availability
No data was used for the research described in the article.
References
- 1.Manzoor Sumaira, et al. Flowery ln2MnSe4 novel electrocatalyst developed via anion exchange strategy for efficient water splitting. Nanomaterials. 2022;12(13):2209. doi: 10.3390/nano12132209. [DOI] [PMC free article] [PubMed] [Google Scholar]
- 2.Abbas Nadeem, et al. Mathematical model of temperature-dependent flow of power-law nanofluid over a variable stretching Riga sheet. Waves in Random and Complex; Media; 2022. pp. 1–18. [Google Scholar]
- 3.Hassan Muhammad, et al. Structural parameters, energy states and magnetic properties of the novel Se-doped NiFe2O4 ferrites as highly efficient electrocatalysts for HER. Ceram. Int. 2022;48(17):24866–24876. [Google Scholar]
- 4.Shatnawi Taqi A.M., Abbas Nadeem, Shatanawi Wasfi. Comparative study of Casson hybrid nanofluid models with induced magnetic radiative flow over a vertical permeable exponentially stretching sheet. AIMS Math. 2022;7(12):20545–20564. [Google Scholar]
- 5.Almessiere Munirah Abdullah, et al. Manganese/yttrium codoped strontium nanohexaferrites: evaluation of magnetic susceptibility and mossbauer spectra. Nanomaterials. 2018;9(1):24. doi: 10.3390/nano9010024. [DOI] [PMC free article] [PubMed] [Google Scholar]
- 6.Nazir Aqsa, Abbas Nadeem, Shatanawi W. On stability analysis of a mathematical model of a society confronting with internal extremism. Int. J. Mod. Phys. B. 2023;37(07) [Google Scholar]
- 7.Zdorovets M.V., et al. Phase transformations in FeCo–Fe2CoO4/Co3O4-spinel nanostructures as a result of thermal annealing and their practical application. J. Mater. Sci., Mater. Electron. 2021;32(12):16694–16705. [Google Scholar]
- 8.Shatnawi Taqi A.M., Abbas Nadeem, Shatanawi Wasfi. Mathematical analysis of unsteady stagnation point flow of radiative Casson hybrid nanofluid flow over a vertical Riga sheet. Mathematics. 2022;10(19):3573. [Google Scholar]
- 9.Kadyrzhanov K.K., et al. Research of the shielding effect and radiation resistance of composite CuBi 2 O 4 films as well as their practical applications. J. Mater. Sci., Mater. Electron. 2020;31:11729–11740. [Google Scholar]
- 10.Abbas Nadeem, et al. Theoretical analysis of induced MHD Sutterby fluid flow with variable thermal conductivity and thermal slip over a stretching cylinder. AIMS Math. 2023;8(5):10146–10159. [Google Scholar]
- 11.El-Shater Reda E., et al. Fabrication of doped ferrites and exploration of their structure and magnetic behavior. Mater. Adv. 2023 [Google Scholar]
- 12.Abbas Nadeem, et al. Numerical analysis of Darcy resistant Sutterby nanofluid flow with effect of radiation and chemical reaction over stretching cylinder: induced magnetic field. AIMS Math. 2023;8:11202–11220. [Google Scholar]
- 13.Kozlovskiy A.L., Zdorovets M.V. Synthesis, structural, strength and corrosion properties of thin films of the type CuX (X= Bi, Mg, Ni) J. Mater. Sci., Mater. Electron. 2019;30:11819–11832. [Google Scholar]
- 14.Kotelnikova Anna, et al. The influence of saccharin adsorption on NiFe alloy film growth mechanisms during electrodeposition. RSC Adv. 2022;12(55):35722–35729. doi: 10.1039/d2ra07118e. [DOI] [PMC free article] [PubMed] [Google Scholar]
- 15.Kozlovskiy A.L., Zdorovets M.V. Effect of doping of Ce4+/3+ on optical, strength and shielding properties of (0.5-x) TeO2-0.25 MoO-0.25 Bi2O3-xCeO2 glasses. Mater. Chem. Phys. 2021;263 [Google Scholar]
- 16.Henaish Ahmed Maher, et al. Structure and optoelectronic properties of ferroelectric PVA-PZT nanocomposites. Opt. Mater. 2023;138 [Google Scholar]
- 17.Yakovenko Olena S., et al. Magnetic anisotropy of the graphite nanoplatelet–epoxy and MWCNT–epoxy composites with aligned barium ferrite filler. J. Mater. Sci. 2017;52:5345–5358. [Google Scholar]
- 18.Yakovenko O.S., et al. Electrophysical properties of epoxy-based composites with graphite nanoplatelets and magnetically aligned magnetite. Mol. Cryst. Liq. Cryst. 2018;661(1):68–80. [Google Scholar]
- 19.Zhang Ying-Fang, et al. Connecting SiO 4 in silicate and silicate chain networks to compute kulli temperature indices. Molecules. 2022;27(21):7533. doi: 10.3390/molecules27217533. [DOI] [PMC free article] [PubMed] [Google Scholar]
- 20.Trukhanov S.V., Kozlenko D.P., Trukhanov A.V. High hydrostatic pressure effect on magnetic state of anion-deficient La0. 70Sr0. 30MnOx perovskite manganites. J. Magn. Magn. Mater. 2008;320(14):e88–e91. [Google Scholar]
- 21.Ghani Muhammad Usman, et al. A paradigmatic approach to find the valency-based K-banhatti and redefined Zagreb entropy for niobium oxide and a metal–organic framework. Molecules. 2022;27(20) doi: 10.3390/molecules27206975. nanocomposites doped with Nb2O5.” Sensors 20(17) (2020) 4851. [DOI] [PMC free article] [PubMed] [Google Scholar]
- 22.Kozlovskiy A., Egizbek K., Zdorovets M.V., Ibragimova M., Shumskaya A., Rogachev A.A., Ignatovich Z.V., Kadyrzhanov K. Evaluation of the efficiency of detection and capture of manganese in aqueous solutions of FeCeOx nanocomposites doped with Nb2O5. Sensors. 2020;20:4851. doi: 10.3390/s20174851. [DOI] [PMC free article] [PubMed] [Google Scholar]
- 23.Trukhanov S.V., et al. Cation ordering and magnetic properties of neodymium-barium manganites. Tech. Phys. 2008;53:49–54. [Google Scholar]
- 24.Kozlovskiy A., et al. Optical and structural properties of AlN ceramics irradiated with heavy ions. Opt. Mater. 2019;91:130–137. [Google Scholar]
- 25.Havare Özge Çolakoglu. Topological indices and QSPR modeling of some novel drugs used in the cancer treatment. Int. J. Quant. Chem. 2021;121:24. e26813. [Google Scholar]
- 26.Abbasi Sina, Sicakyüz Çigdem, Erdebilli Babek. Designing the home healthcare supply chain during a health crisis. J. Eng. Res. 2023 [Google Scholar]
- 27.Mondal Sourav, De Nilanjan, Pal Anita. Topological indices of some chemical structures applied for the treatment of COVID-19 patients. Polycycl. Aromat. Compd. 2022;42(4):1220–1234. [Google Scholar]
- 28.Abbasi Sina, Daneshmand-Mehr Maryam, Ghane Kanafi Armin. Green closed-loop supply chain network design during the coronavirus (COVID-19) pandemic: a case study in the Iranian automotive industry. Environ. Model. Assess. 2023;28(1):69–103. doi: 10.1007/s10666-022-09863-0. [DOI] [PMC free article] [PubMed] [Google Scholar]
- 29.Sheikholeslami Seyed Mahmoud, Jahanbani Akbar, Shao Zehui. On the molecular structure of Remdesivir for the treatment of Covid-19. Comput. Methods Biomech. Biomed. Eng. 2021;24(9):995–1002. doi: 10.1080/10255842.2020.1863380. [DOI] [PubMed] [Google Scholar]
- 30.Ghani Muhammad Usman, et al. Hex-derived molecular descriptors via generalised valency-based entropies. IEEE Access. 2023 [Google Scholar]
- 31.Khan Abdul Rauf, et al. Fundamental aspects of skin cancer drugs via degree-based chemical bonding topological descriptors. Molecules. 2023;28(9):3684. doi: 10.3390/molecules28093684. [DOI] [PMC free article] [PubMed] [Google Scholar]
- 32.Abbasi Sina, Ahmadi Choukolaei Hassan. A systematic review of green supply chain network design literature focusing on carbon policy. Decis. Anal. J. 2023 [Google Scholar]
- 33.Abbasi Sina, et al. Performance measurement of the sustainable supply chain during the COVID-19 pandemic: a real-life case study. Found. Comput. Decision Sci. 2022;47(4):327–358. [Google Scholar]
- 34.Chang Xie, et al. Molecular irregularity indices of nanostar, fullerene, and polymer dendrimers. J. Chem. 2020;2020:1–12. [Google Scholar]
- 35.Arockiaraj Micheal, et al. Entropy structural characterization of zeolites BCT and DFT with bond-wise scaled comparison. Sci. Rep. 2023;13(1) doi: 10.1038/s41598-023-37931-2. [DOI] [PMC free article] [PubMed] [Google Scholar]
- 36.Abbasi Sina. 2023. Environmental impact assessment with rapid impact assessment matrix method during the COVID-19 pandemic: a case study in Tehran. [Google Scholar]
- 37.Abbasi Sina, Daneshmand-Mehr Maryam, Ghane K. Designing a tri-objective, sustainable, closed-loop, and multi-echelon supply chain during the COVID-19 and lockdowns. Found. Comput. Decision Sci. 2023;48:1. [Google Scholar]
- 38.Ghani Muhammad Usman, et al. Characterizations of chemical networks entropies by K-banhatii topological indices. Symmetry. 2023;15(1):143. [Google Scholar]
- 39.Ghani Muhammad Usman, et al. Entropies via various molecular descriptors of layer structure of H 3 BO 3. Mathematics. 2022;10(24):4831. [Google Scholar]
- 40.Basit M.A., et al. Numerical simulation of bioconvective Casson nanofluid through an exponentially permeable stretching surface. Int. J. Mod. Phys. B. 2023 [Google Scholar]
- 41.Abdul Basit Muhammad, et al. Partial differential equations modeling of bio-convective sutterby nanofluid flow through paraboloid surface. Sci. Rep. 2023;13(1):6152. doi: 10.1038/s41598-023-32902-z. [DOI] [PMC free article] [PubMed] [Google Scholar]
- 42.Farooq Umar, et al. Recent progress in Cattaneo-Christov heat and mass fluxes for bioconvectional Carreau nanofluid with motile microorganisms and activation energy passing through a nonlinear stretching cylinder. Ain Shams Eng. J. 2023 [Google Scholar]
- 43.Prabhu S., et al. Computational analysis of some more rectangular tessellations of kekulenes and their molecular characterizations. Molecules. 2023;28(18):6625. doi: 10.3390/molecules28186625. [DOI] [PMC free article] [PubMed] [Google Scholar]
- 44.Ismail Rashad, et al. A novel perspective for M-polynomials to compute molecular descriptors of borophene nanosheet. Sci. Rep. 2023;13(1) doi: 10.1038/s41598-023-37637-5. [DOI] [PMC free article] [PubMed] [Google Scholar]
Associated Data
This section collects any data citations, data availability statements, or supplementary materials included in this article.
Data Availability Statement
No data was used for the research described in the article.