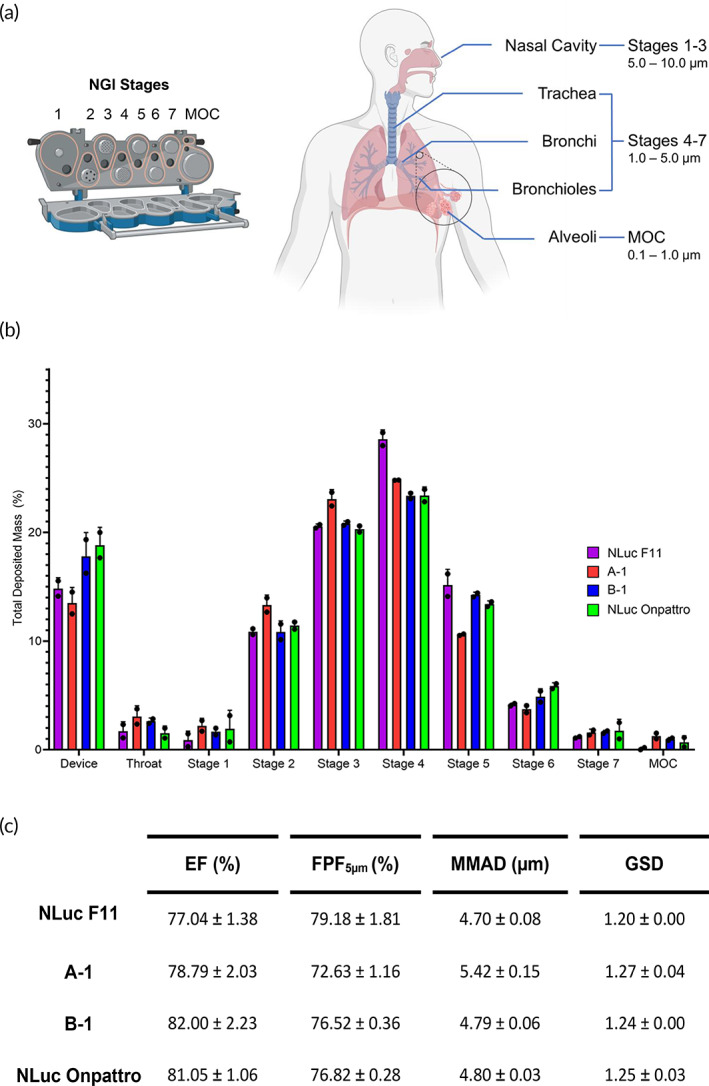
FIGURE 5.

NGI at a flow rate of 15 L/min. (a) NGI stages and droplet distribution in the human respiratory tract according to particle size. Created with BioRender.com. (b) Deposition profile across the device, throat, stages 1–7, and MOC (n = 2; mean ± standard deviation [SD]). (c) Aerodynamic performance (n = 2; mean ± SD). MOC, micro‐orifice collector; NGI, Next Generation Impactor.
