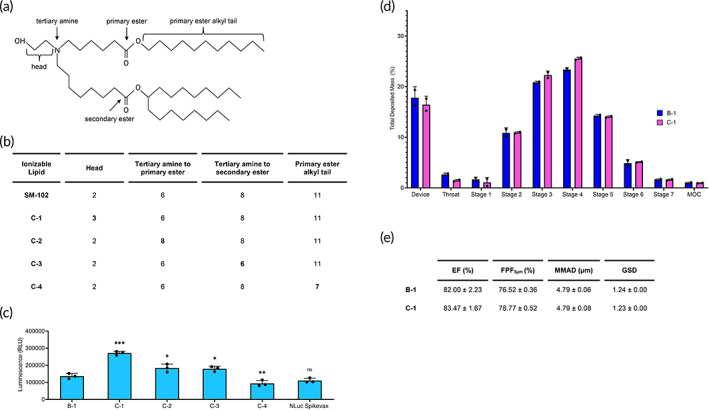
FIGURE 6.

The impact of SM‐102 analogs on LNP transfection. (a) Schematic of SM‐102 groups relevant to the analogs. (b) The number of carbons in SM‐102 analog structures compared to SM‐102. (c) Quantification of luminescence from ALI Calu‐3 cells 24 h after transfection with aerosolized SM‐102 analog LNPs delivering 1000 ng NLuc mRNA. Significance is relative to B‐1 (n = 3; mean ± standard deviation [SD], *p < 0.05, **p < 0.01, ***p < 0.001, ns = not statistically significant; Student's t test, double‐tailed). (d) Deposition profile of C‐1 compared to B‐1 across the device, throat, stages 1–7, and MOC (n = 2; mean ± SD). (e) Aerodynamic performance of C‐1 compared to B‐1 (n = 2; mean ± SD). ALI, air‐liquid interface; LNP, lipid nanoparticle; MOC, micro‐orifice collector.
