
FIGURE 4.
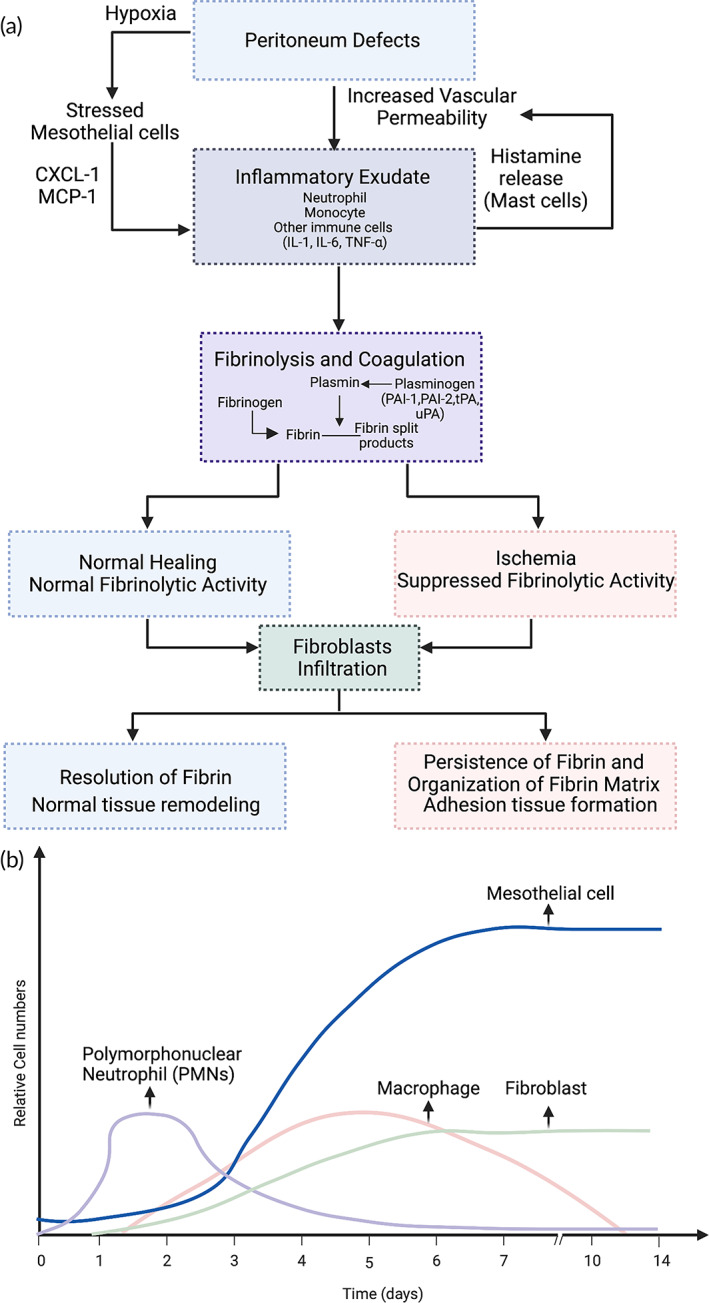
(a) Schematic illustration of the pathogenesis of adhesion formation showing the interactions between inflammation, ischemia or hypoxia, fibrinolysis, and coagulation. (b) Relative cellular numbers can change the rate of postoperative adhesion formation.