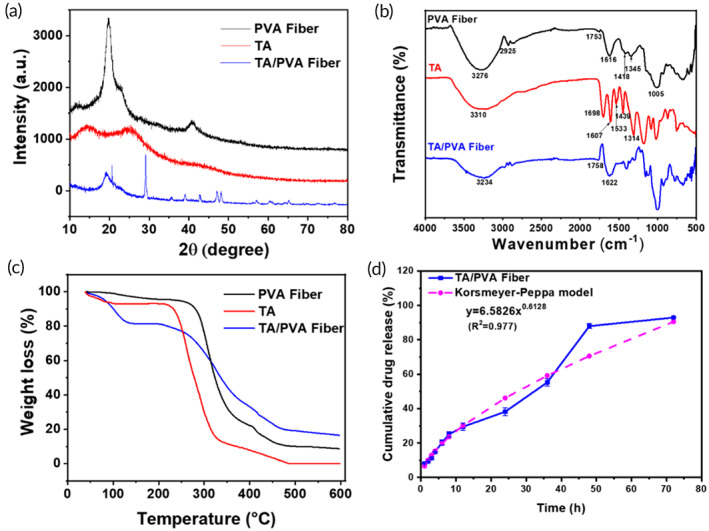
FIGURE 2.

Characterizations of the fibers. (a) X‐ray diffraction (XRD) patterns. (b) Fourier‐transform infrared spectroscopy (FT‐IR) spectra. (c) thermogravimetric analysis (TGA) curves. (d) The cumulative releasing profile and the Korsmetyer–Peppas model fitting curve of tannic acid (TA from TA/polyvinyl alcohol (PVA) fiber.
