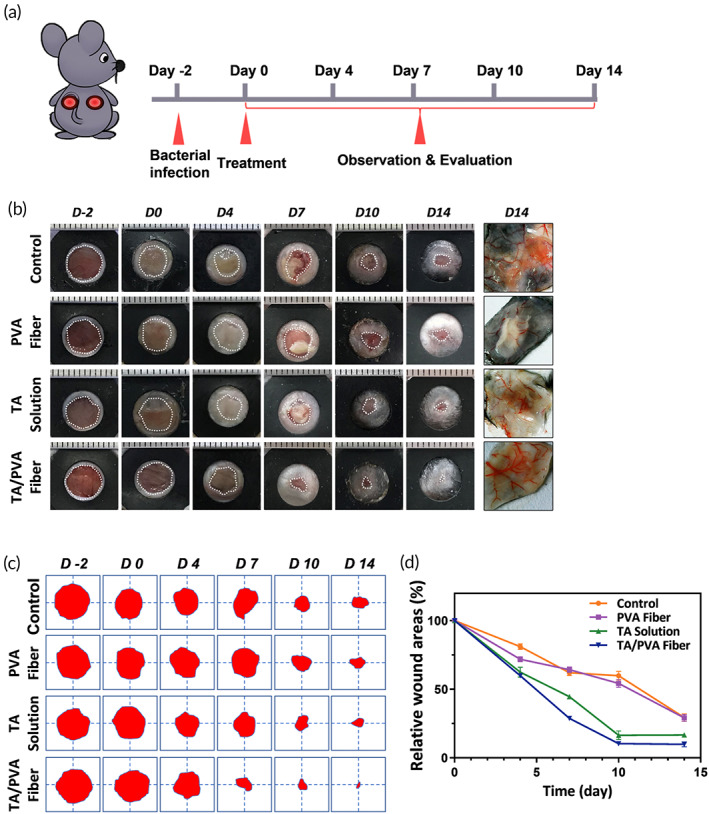
FIGURE 5.

(a) Schematic diagram of the in vivo treatments of phosphate‐buffered saline (PBS (Control)), polyvinyl alcohol (PVA) fiber, tannic acid (TA) solution, and TA/PVA fiber on a mouse model. (b) Representative images of wounds after different treatments. The rightest column: representative dermatoscopic photographs of the skin tissues on Day 14 after different treatments. (c) Wound area traces at different times. The red color area represented the residual wounds. (d) Quantitative analysis of wound areas of different groups.
