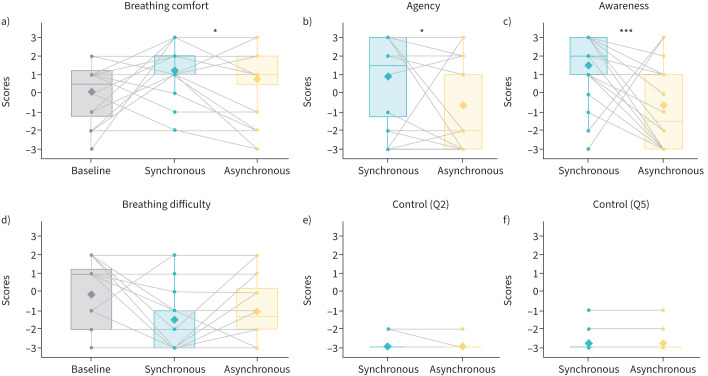
FIGURE 3.
Breathing comfort (a), agency (b), awareness (c), breathing difficulty (d) and control item (e, f) test results. a–c) Subjective measures for which the main effect of the experimental manipulation was significant. *: p<0.05; ***: p<0.001. d–f) Subjective measures for which the main effect of the experimental manipulation was nonsignificant. The boxplots depict subjects’ ratings during the asynchronous condition compared to the synchronous condition, independent of experimental sequence. The thick line within a boxplot represents the median, the diamond represents the mean, the upper boundary of the box indicates the 25th percentile (Q1) and lower boundary the 75th percentile (Q3). The whiskers above and below the box indicate the minimal and maximal values (Q1–1.5×IQR and Q3+1.5×IQR, respectively), while points above the upper or below the whiskers indicate outliers. Subjective ratings were measured using a 7-point Likert scale with −3=strongly disagree, −2=disagree, −1=somewhat disagree, 0=neither agree nor disagree, 1=somewhat agree, 2=agree, and 3=strongly agree.

