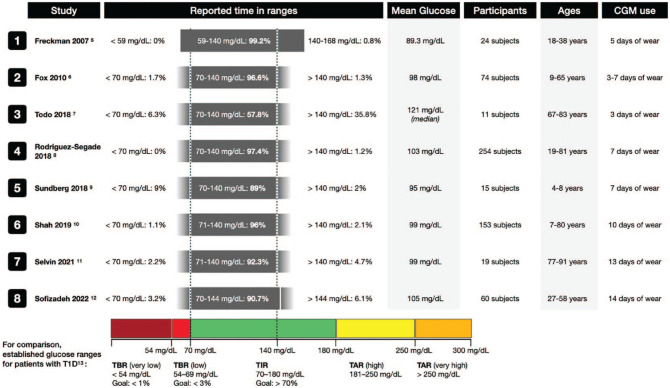
Figure 1.
Results of studies reported since 2007 using CGMs to determine times spent in various ranges of glucose concentrations in populations of people with normal baseline fasting and glucose tolerance tests. Under “reported time in ranges,” the gray bars represent the range of glucoses reported in each study. If the original study reported exact minimum or maximum values, the gray bar has hard edges; otherwise it has faded edges if only “less than” or “greater than” were used in the data reporting. The dotted lines at 70mg/dL and 140 mg/dL are not shown for studies that used different cut-off values. Established target times in ranges for patients with type 1 diabetes per the International Consensus on Time in Range. 13 Abbreviations: CGM, continuous glucose monitor; T1D, type 1 diabetes; TAR, time above range; TBR, time below range; TIR, time in range.

