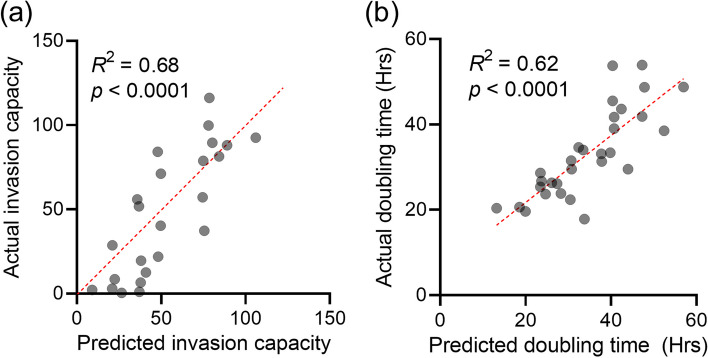
Fig. 4.
Results of the multiple linear regression. a Multiple linear regression of invasion capacity. The invasion capacity predicted by the invasion panel for each sample in the Test set is plotted on the x-axis, while the actual invasion capacity is plotted on the y-axis. b Multiple linear regression of proliferation capacity. The doubling time predicted by the invasion panel for each sample in the Test set is plotted on the x-axis, while the actual doubling time is plotted on the y-axis. (R2—coefficient of determination; p—p value.)

