
Figure 1: A hypoxic signature is enriched in inflammatory fibroblasts in PDAC.
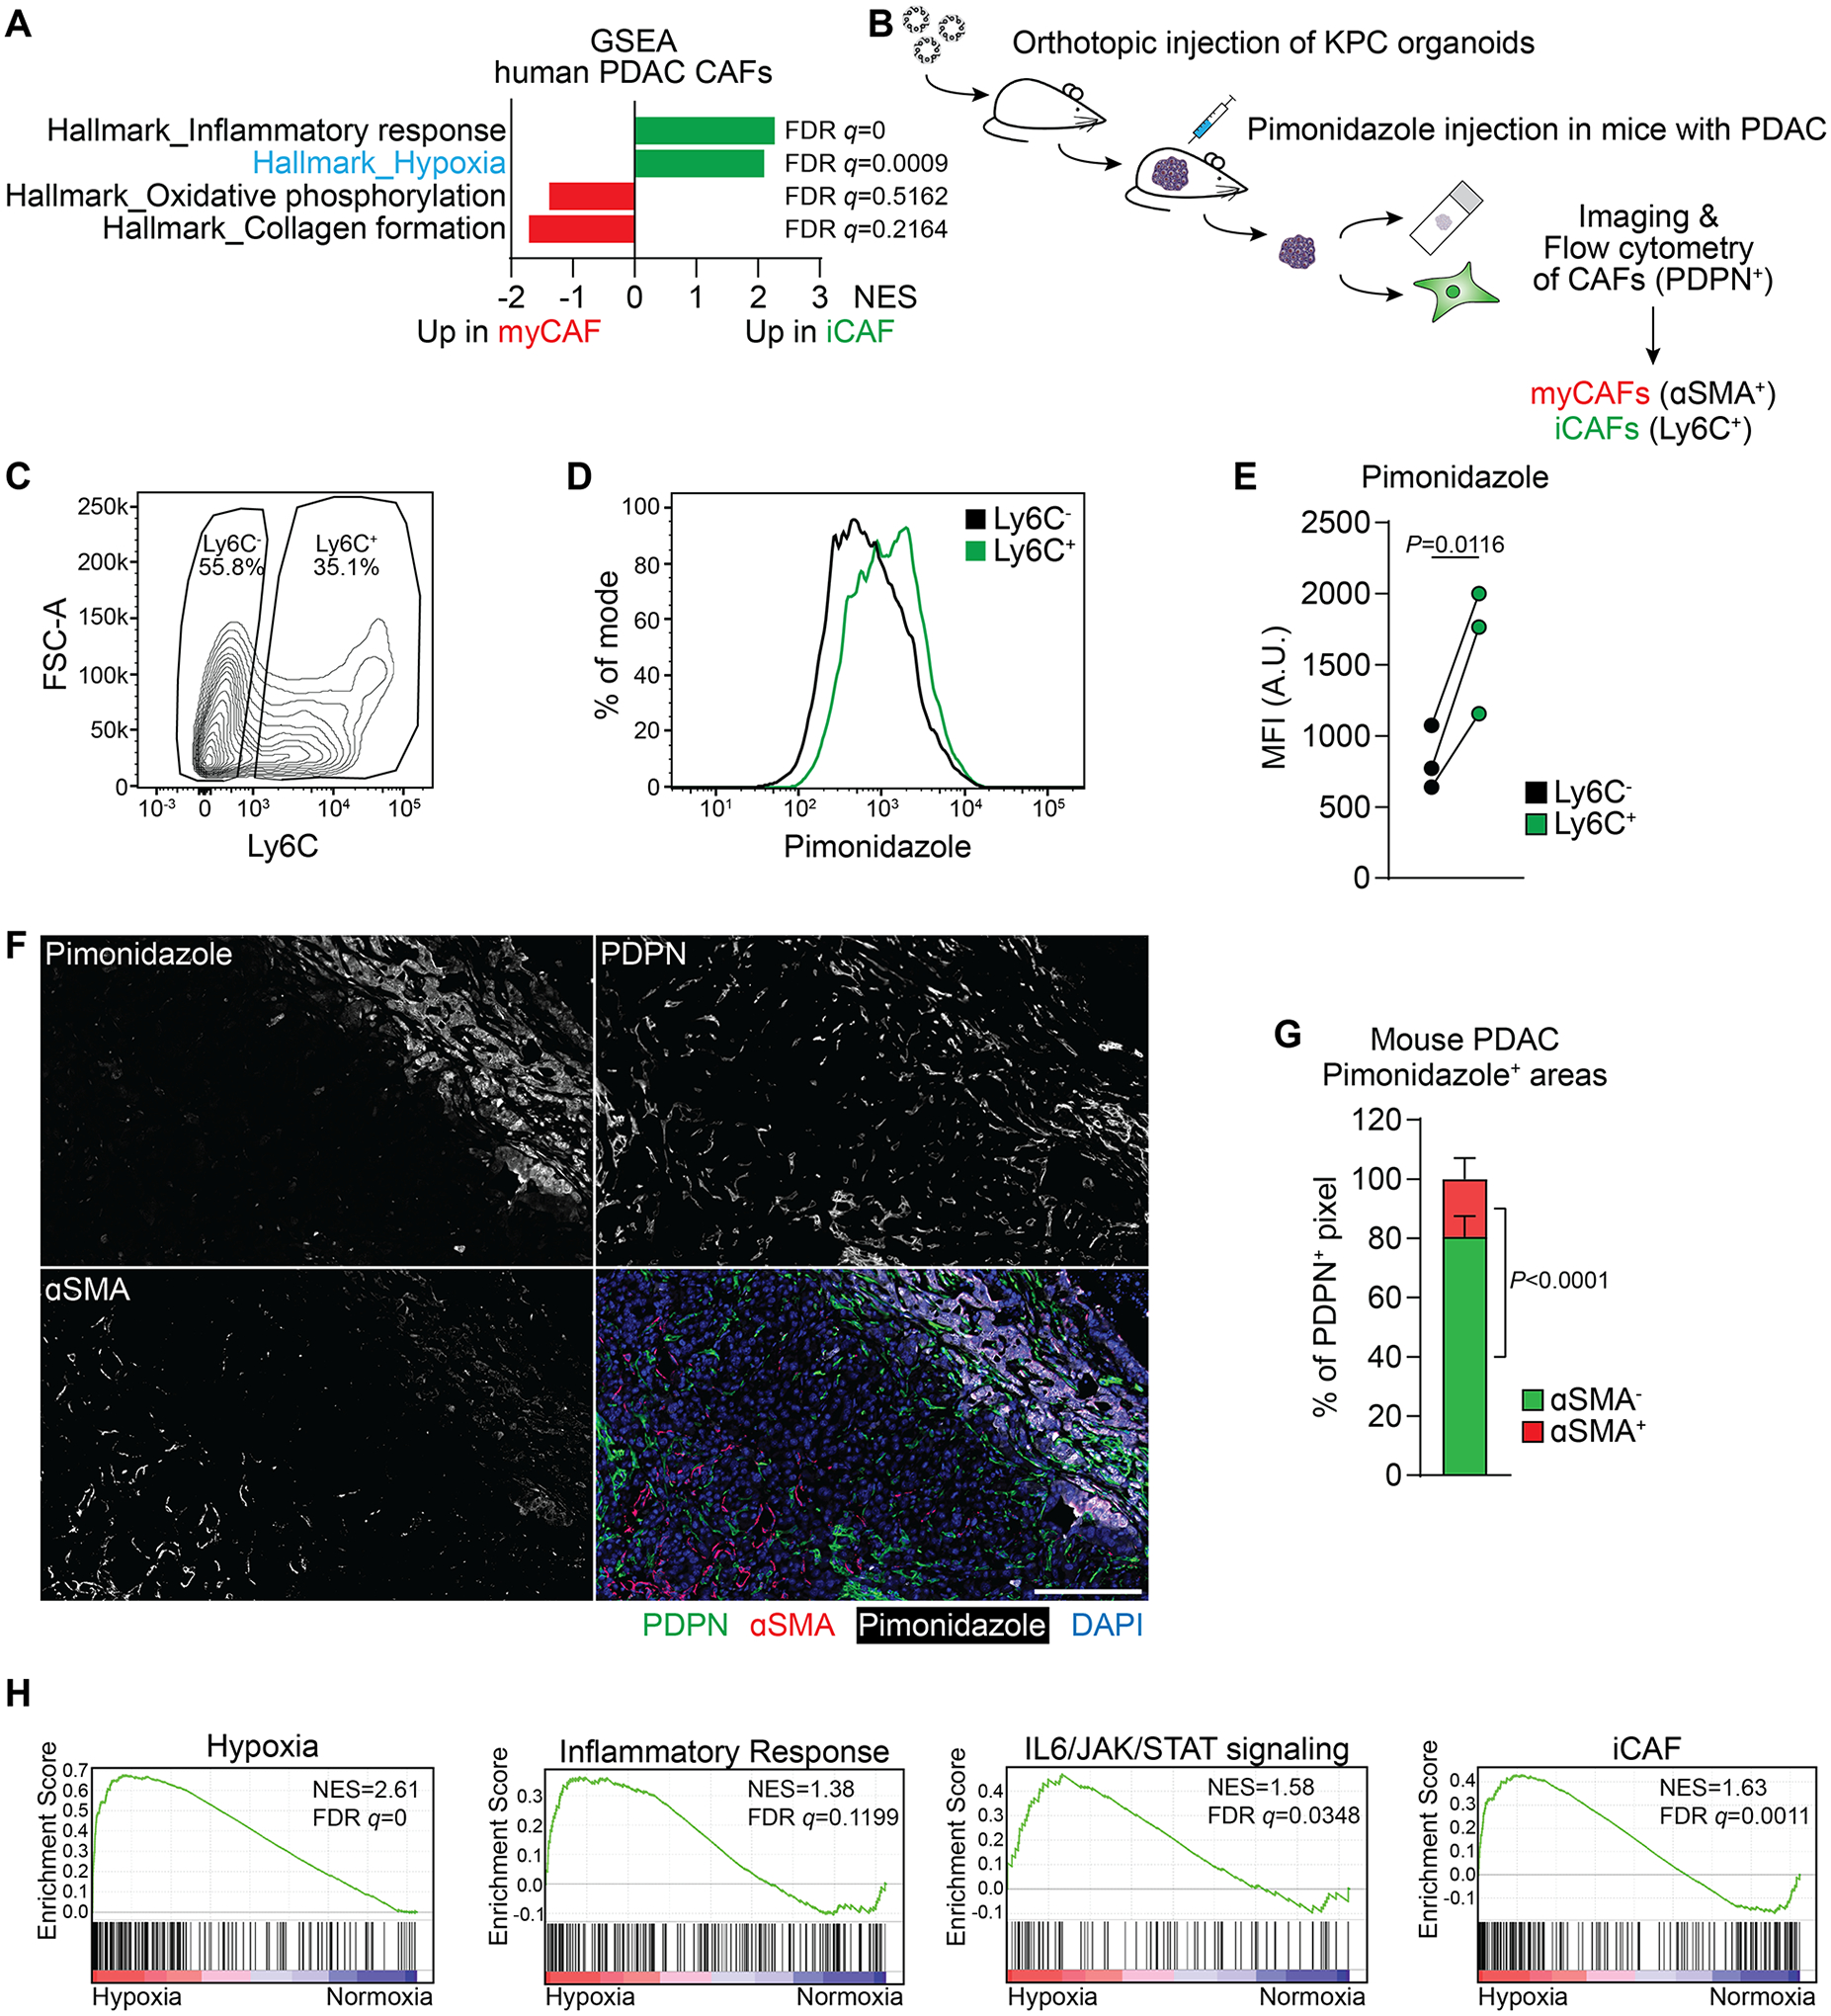
(A) Single sample Gene Set Enrichment Analysis (ssGSEA) of selected hallmark signatures in myofibroblastic CAFs (myCAFs) and inflammatory CAFs (iCAFs) based on single-cell RNA-sequencing (scRNA-seq) data from human PDAC. Data from (5).
(B) Schematic of experimental workflow to analyze Pimonidazole enrichment and localization in mouse PDAC tumors arising from orthotopic transplantation of KPC organoids.
(C-E) Analysis of Pimonidazole in Ly6C+ and Ly6C− cells among live, CD31−CD45−EpCAM−PDPN+ cells in PDAC tumors. (C) Gating for Ly6C in PDPN+ cells. (D) Histogram of fluorescence intensity and (E) quantification of Pimonidazole median fluorescence intensity (MFI) comparing Ly6C+ and Ly6C− cells. A.U. = arbitrary units. N=3 mice. P-value was calculated by ratio paired t-test.
(F, G) Immunofluorescence staining of Pimonidazole, PDPN and αSMA in mouse PDAC tumors. (F) Representative image. Nuclei are labeled with DAPI. Scale bar = 500 μm. (G) Quantification of αSMA− and αSMA+ pixel among PDPN+ pixel within Pimonidazole-stained regions. N=8 sections from 4 mice. Data represent mean+SD. P-value was calculated by ratio paired t-test.
(H) GSEA comparing PSCs cultured in normoxia (20% O2) or hypoxia (0.5% O2) for 48h. iCAF signature derived from (4). Other signatures represent Hallmark signatures from MSigDB. N=3 biological replicates.