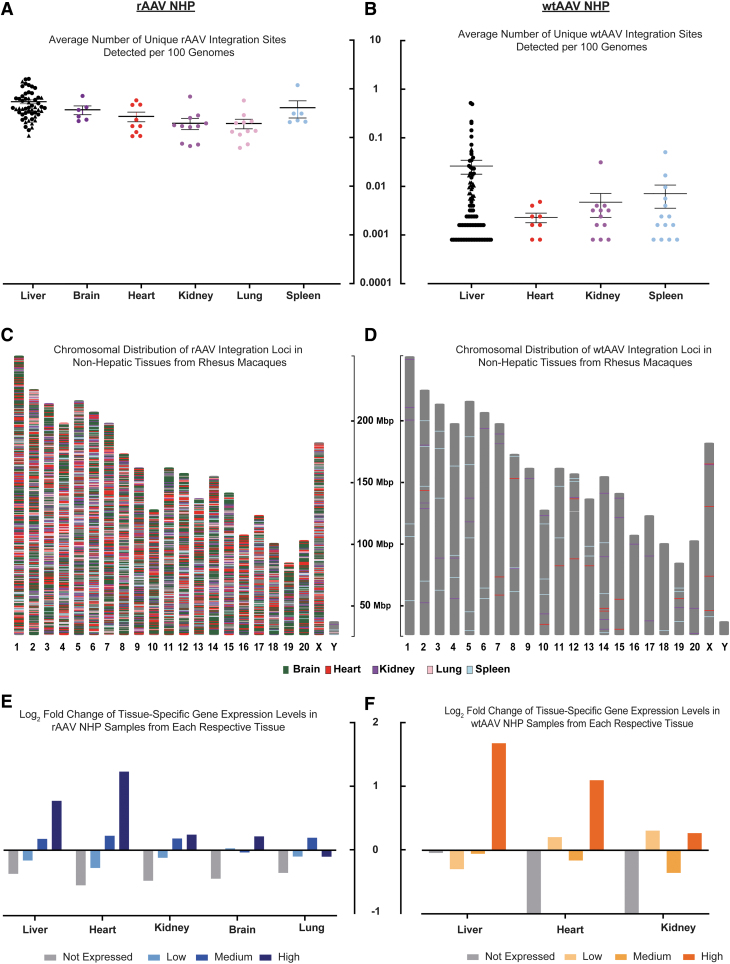
Figure 4.
Quantitative and qualitative observations of rAAV and wtAAV integration loci in macaques are not limited to hepatic tissue. (A, B) Number of unique AAV integration sites detected in different tissues from (A) rAAV-treated rhesus NHPs and (B) wtAAV rhesus NHPs. This number was normalized to the number of unique integration sites per 100 genomes based on the input number of genomes during library generation. The liver results include all NHPs from our cohort, including the NHPs with other tissues studied. (C, D) Chromosomal graph showing the locations in the rhesus genome of UILs detected in tissue samples from (C) rAAV-treated NHPs and (D) wtAAV NHPs. The chromosome color is gray, and color-coded lines indicate locations of UILs according to the tissue in which they were detected. (E, F) For liver tissue samples from the 13 rAAV (E) and 18 wtAAV (F) rhesus with multiple tissues, the integration loci were annotated for their location within genic regions. Expression levels were determined by nx in the human liver for each annotated gene. Categories were determined as follows: genes not expressed: 1 < nx; genes with low expression: 1 ≤ nx <10; genes with medium expression: 10 ≤ nx <100; genes with high expression: 100 ≤ nx. Each value was compared with that of a random distribution, and the log2-fold change from the random distribution was plotted. nx, normalized expression.

