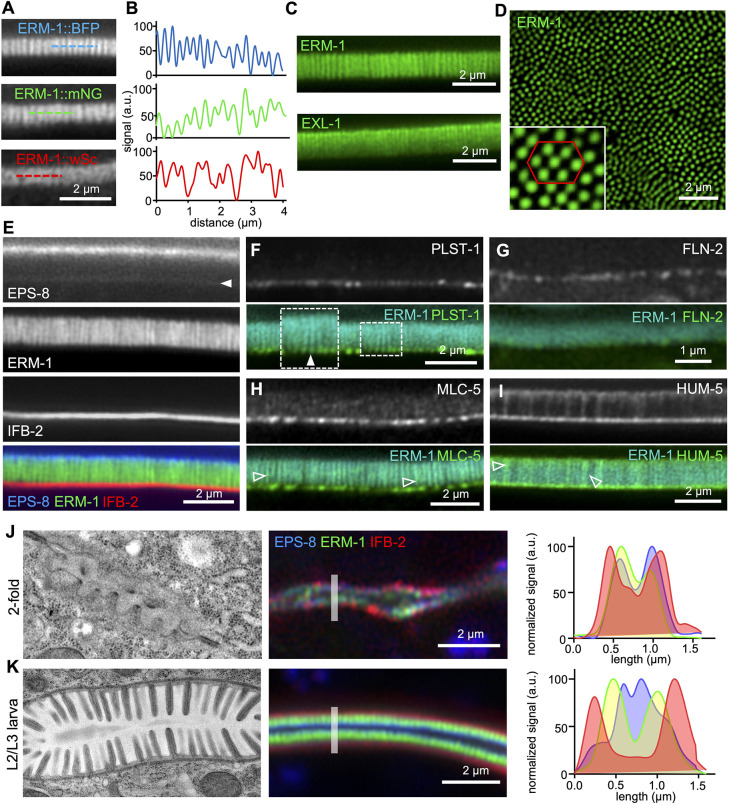
Fig. 3.
Super-resolution imaging of the brush border. (A,B) Super-resolution images of ERM-1 endogenously tagged with BFP, mNG and wSc in C. elegans young adults. The graphs in B show the normalized intensity profile along a 4 µm-long dashed line, as represented in A. (C) Super-resolution images of ERM-1::mNG or EXL-1::mNG in young adults. (D) Transversal super-resolution image of the brush border performed on a young adult C. elegans strain endogenously expressing ERM-1::mNG. Inset shows a magnified region with a red hexagon indicating the putative hexagonal packing of microvilli. (E-I) Representative super-resolution images of the indicated microvilli markers endogenously tagged with mNG (ERM-1, HUM-5), GFP (PLST-1, MLC-5), BFP (EPS-8), mVenus (FLN-2) or wSc (IFB-2) in young adults. In F, inset shows higher magnification of the boxed ROI. Filled and unfilled arrowheads show the colocalization between ERM-1 and the indicated markers at the base and along the microvilli, respectively. (J,K) Left: TEM images show the shape of the brush border at the corresponding developmental stage. Middle: Super-resolution images of the brush border in 2-fold embryo and L2-L3 larvae co-expressing EPS-8::BFP, ERM-1::mNG and IFB-2::wSc. Right: Histograms corresponding to the signal intensity profile of the three markers along the gray line depicted on the fluorescence images. a.u., arbitrary units.

