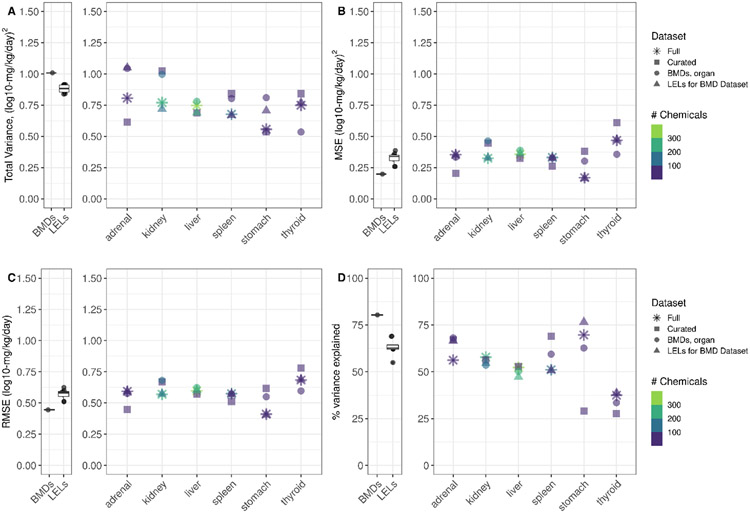
Figure 3. Variance, MSE, RMSE, and % variance explained.
In A-D, the first panel illustrates study-level values for BMDs and LELs (LEL values derived in Pham et al. 2020) for comparison. The second panel for A-D indicate the values at the organ-level, as indicated. In A, total variance estimates for the full organ-level dataset (asterisk), the curated organ-level dataset (square), the BMD dataset by organ (circle), and the LELs corresponding to the BMD dataset (triangle) are shown. In B, C, and D, MSE (unexplained variance), RMSE, and the % total variance explained values for each dataset are shown, respectively. Color indicates the number of chemicals represented in each dataset.

