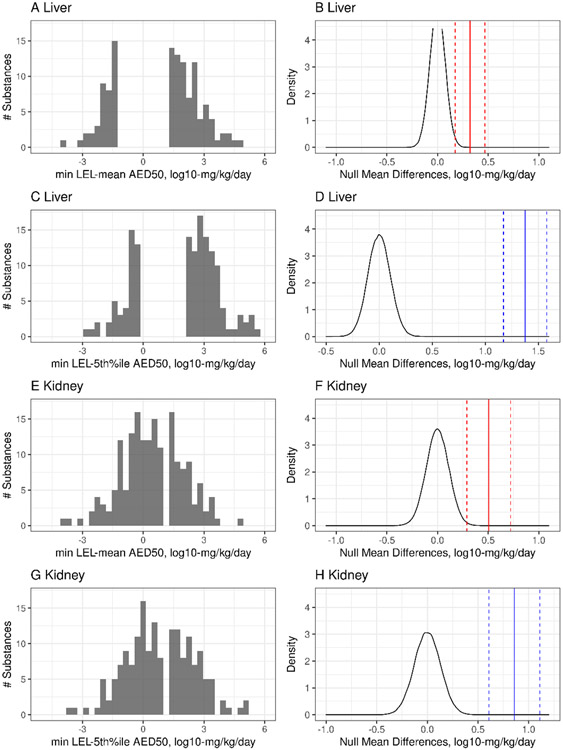
Figure 6. LEL-AED50 differences and the null mean difference distribution.
A, B, E, F: the distribution of the minimum LEL – mean AED50 and the matched null mean difference distribution, where the black line represents the null mean difference distribution centered at zero, the solid red line represents the mean difference of the minimum LEL- mean AED50 values, and the dotted red lines represent the upper and lower 95% CI bounds on this mean difference; C, D, G, H: the distribution of the minimum LEL – 5th percentile AED50 and the matched null mean difference distribution, where the black line represents the null mean difference distribution centered at zero, the solid blue line represents the mean difference of the minimum LEL- 5th percentile AED50 values, and the dotted blue lines represent the upper and lower 95% CI bounds on this mean difference. All x-axis units are log10-mg/kg/day.

