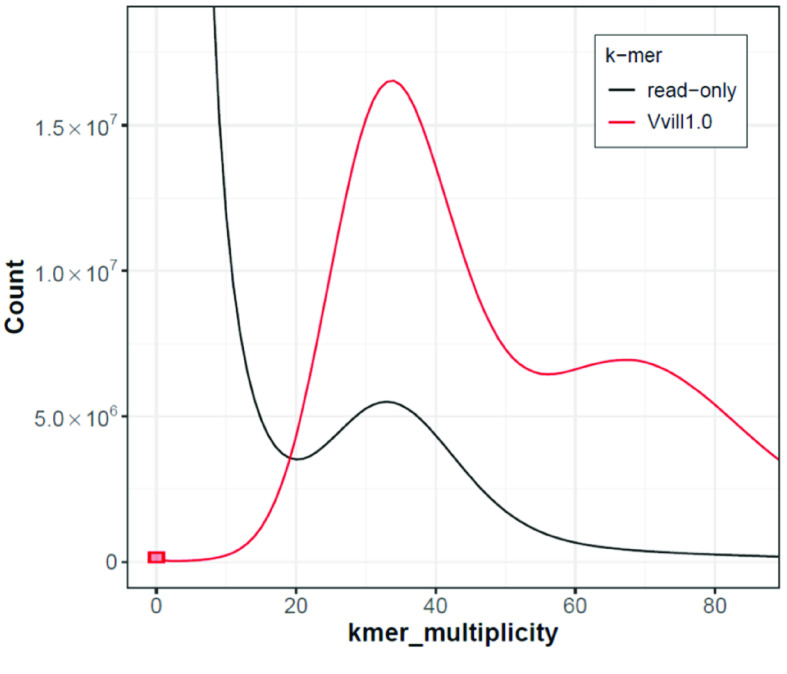
Figure 6.
K-mer assembly spectra plot generated by merqury [46] showing the distribution of k-mers (k = 21) found in the Illumina short-read set (black, read-only) and k-mers found in our Vvill1.0 assembly (red, Vvill1.0). The red bar at zero multiplicity indicates k-mers found only in the assembly. The read-only peak at ∼35× likely represents heterozygous variants missing from the assembly.

