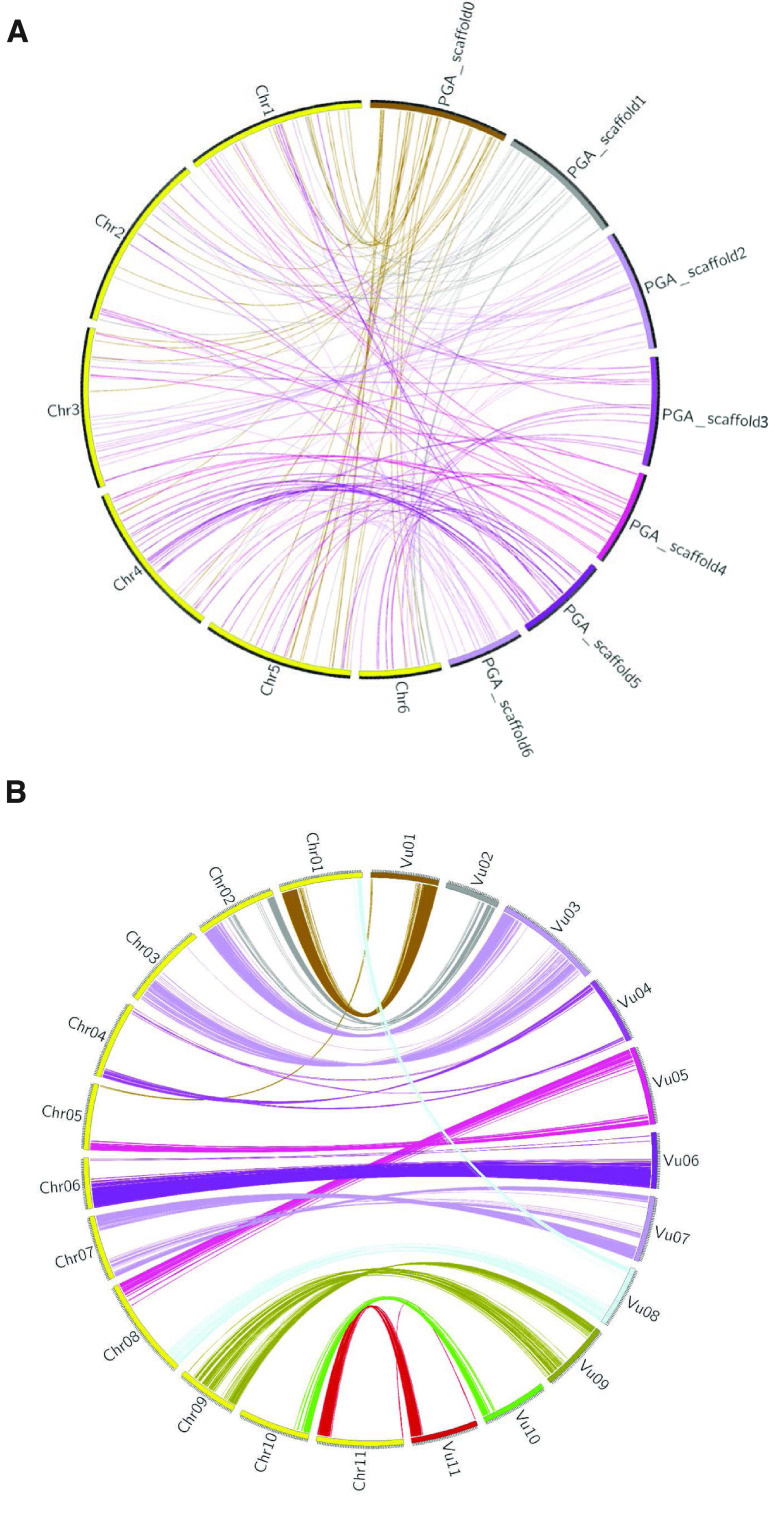
Figure 7.
Circos plot showing syntenic regions shared between (A) the V. sativa assembly (yellow outer bands) and Vvill1.0 (multi-colored outer bands) genomes, or (B) the Phaseolus vulgaris (yellow) and vigna unguiculata (multi-colored) genomes [48]. Ribbons (colored matching the Vvill1.0 scaffolds (A) or the vigna unguiculata chromosomes (B)) represent the pairwise alignments of 100 kbp or larger identified using minimap2 [49].

