
Fig. 5. Divergent expression across conserved cell types.
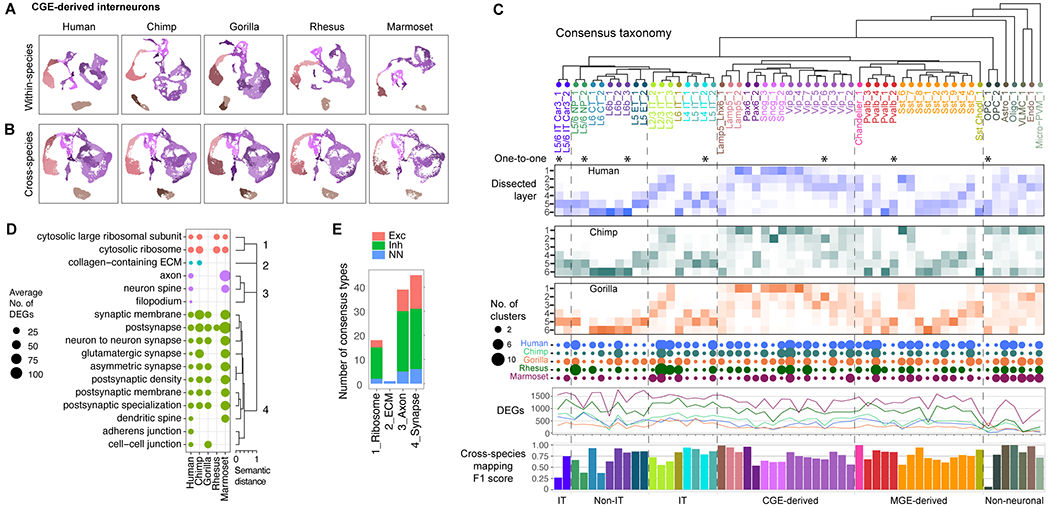
(A) UMAPs of CGE-derived interneuron expression generated for each species and colored by within-species cell types. (B) UMAPs of CGE interneuron expression integrated across the five species and with the same coloring as A. (C) Consensus taxonomy of 57 homologous cell types identified in all five species (*, one-to-one match across all species). For great ape species, heatmaps denote the proportion of nuclei dissected from layers 1 through 6 for each type. Dot plot denotes the number of within-species clusters that are associated with each consensus type. Line plots show the number of hDEGs per consensus type with fold-change (FC) > 1.4 for each species (colors as in dot plot). Barplots show the average classification accuracy (F1 score) across the five species using scPoli (84) (Fig. S12). (D) Summary of GO enrichment analysis of species DEGs. Cellular component terms are shown that were significantly enriched for hDEGs in at least one consensus type and form four distinct groups of similar GO terms. (E) Summary of the number of consensus types that express hDEGs that were enriched for at least one term in the four semantic GO groups.