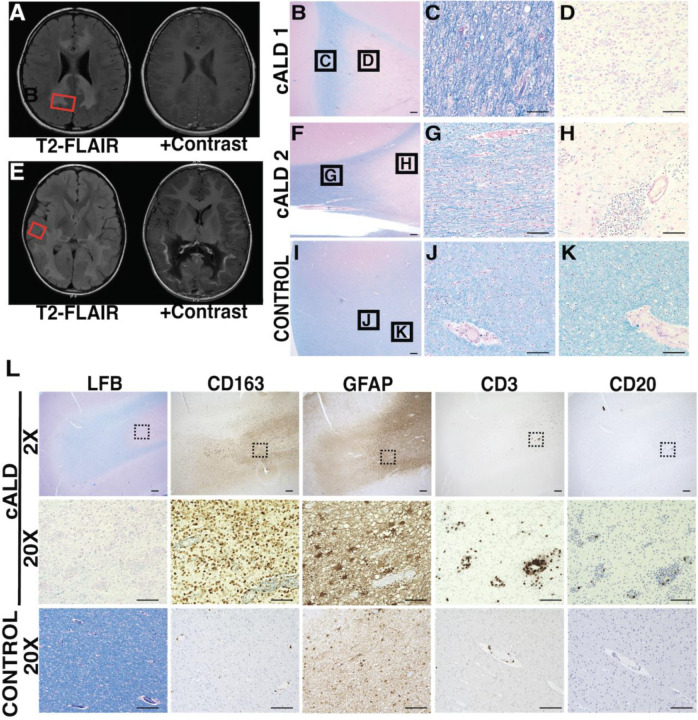
Figure 1. In boys with cALD, brain lesions exhibit important radiologic and histologic hallmarks.
(A, E) Axial MR imaging from two children with cALD highlight areas of demyelination (T2 FLAIR intensities) and vascular breakdown (contrast enhancement). Red boxes indicate representative areas sampled for histopathological images. (B-K) LFB + H&E histology of postmortem tissue from cALD patients with varying severity of demyelination in lesions. Histology highlights regions of extensive, active demyelination (C, G) and early gliosis (D, H) compared to healthy, unaffected control (I-K). B, F, I: 2X magnification of representative sections, scale bar: 400um. C, D, G, H, J, K: 20X magnificent of respective sections, scale bar: 100um. (L) Immunohistochemistry of representative demyelinated cALD lesion shows infiltration of microglia/ macrophages (CD163), and to a lesser extent T-cells (CD3) within the lesion. B cells (CD20) are present in lower abundance. Scale bar for 2X magnification represents 400µm; black boxes indicate corresponding areas shown at 20X magnification. Scale bar for 20X magnification represents 100µm

