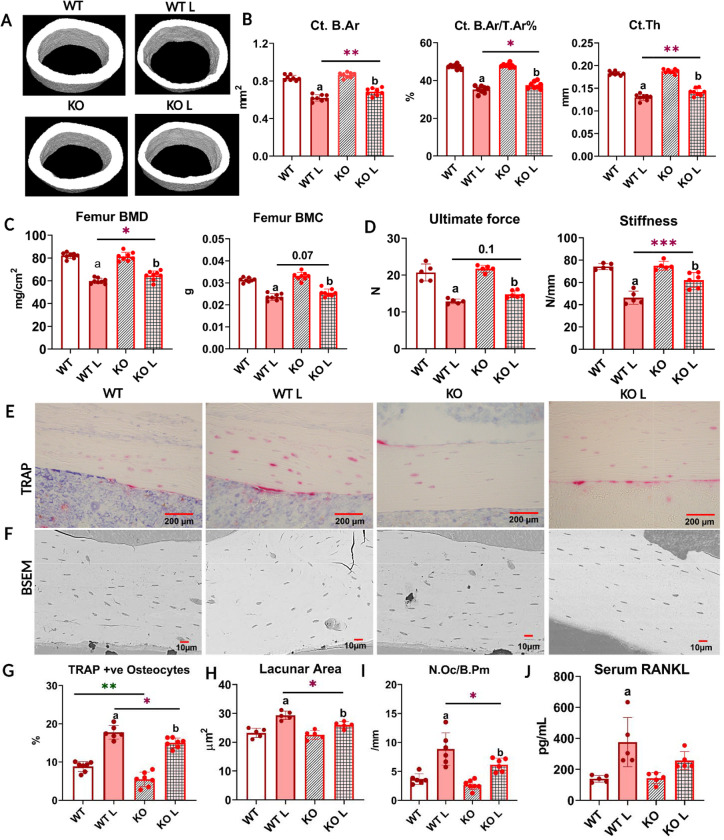
Fig 1: With lactation, FNDC5 global KO mice lose less bone and are mechanically stronger compared to WT.
A: Respective μCT images of femoral midshafts from WT virgin (WT), KO virgin (KO), WT lactation (WT L), and KO lactation (KO L) mice.
B: μCT analysis of femoral cortical bone parameters of virgin and lactating WT and KO female mice reported as cortical bone area (Ct. B.Ar), cortical bone area fraction (Ct. B.Ar/ T.Ar %), and cortical thickness (Ct. Th).
C: Ex vivo DXA analysis for BMD and BMC of femurs from virgin and lactating WT and KO female mice.
D: 3-point bending analysis of WT and KO virgin and lactating mice reported as ultimate force and stiffness.
E: Representative TRAP-stained images of cortical bone from WT virgin (WT), WT lactation (WT L), KO virgin (KO), and KO lactation (KO L) mice.
F: Representative backscatter scanning electron microscope (BSEM) images of WT virgin (WT), KO virgin (KO), WT lactation (WT L), and KO lactation (KO L) mice femur at 400X magnification.
G: Percent TRAP-positive osteocytes (TRAP +ve) in tibia from virgin and lactating WT and KO mice.
H: Osteocyte lacunar area in femurs from virgin and lactating WT and mice.
I: Osteoclast number per bone perimeter in tibia from virgin and lactating WT and KO mice.
J: Serum RANKL levels in virgin and lactating WT and KO mice.
4–5-month-old WT and KO virgin and lactating mice, n= 5–8/group. a= Significantly different from WT, b= Significantly different from KO, *= p< 0.05, **= p< 0.01, ***= p< 0.001. 2-way ANOVA was performed for statistical analysis. The interaction was not significant.

