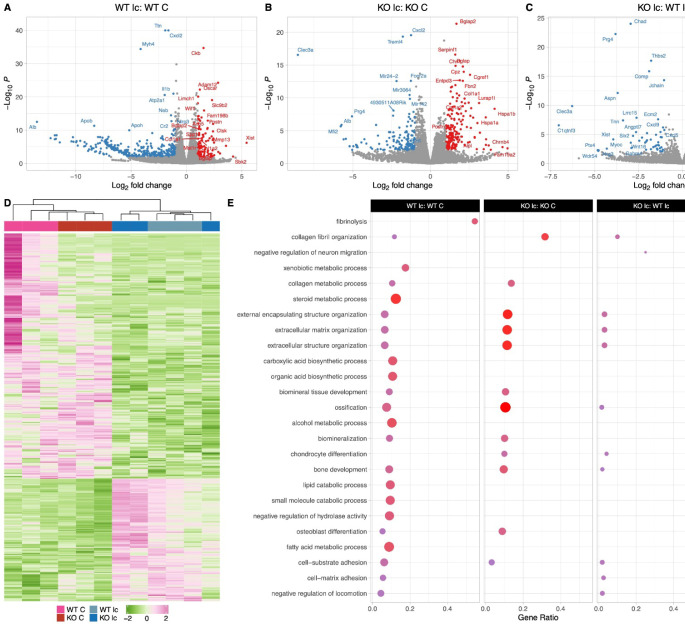
Fig 6: The Osteocyte transcriptomes from male WT and KO mice are distinct when challenged with a low-calcium diet.
A: Volcano plot showing the significantly regulated genes between WT male control (WT C) and WT male low-calcium diet-fed mice (WT lc) osteocyte transcriptome.
B: Volcano plot showing the significantly regulated genes between KO male control (KO C) and KO male low-calcium diet-fed mice (KO lc) osteocyte transcriptome.
C: Volcano plot showing the significantly regulated genes between WT male low-calcium diet-fed mice (WT lc) and KO male low-calcium diet-fed mice (KO lc) osteocyte transcriptome.
D: Heat map showing the differentially expressed genes among WT male control (WT C), WT male low-calcium diet-fed mice (WT lc), KO female control (KO C), and KO male low-calcium diet-fed mice (KO lc) osteocyte transcriptome.
E: Gene set enrichment analysis of Gene Ontology (GO) analysis of the significantly regulated genes between WT male control (WT C) and WT male low- calcium diet-fed mice (WT lc) osteocyte transcriptome, between KO male control (KO C) and KO male low-calcium diet-fed mice (KO lc) osteocyte transcriptome, and WT male low-calcium diet-fed mice (WT lc) and KO male low-calcium diet-fed mice (KO lc) osteocyte transcriptome. The figure shows the union of the top 10 GO terms of each analysis. If a term in the union, besides the top 10, is also significant (adjusted p-value less than 0.05 was used for GO analysis) in an analysis, it is also included in the figure.
The latter group in the figure’s title is the reference group. n=3/group. For DEG analys unadjusted p-value <0.01 was used.

