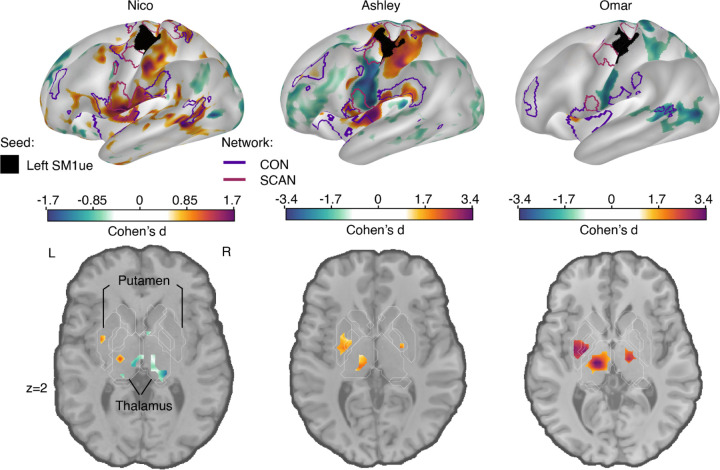
Figure 1: Disuse-driven changes in functional connectivity (FC) of effector-specific primary somatomotor cortex (L-SM1ue).
Individual-specific plasticity effect size (Cohen’s d) maps showing changes in FC during casting (Cast − Pre) for the L-SM1ue (black), and for each participant (left to right columns: Nico, Ashley, Omar). For reference, a Cohen’s d of 0.8 is generally considered a large effect size. Only significant effects after cluster correction at p < 0.05 (see Methods) are displayed. With a TR that is twice as long, Nico’s effect sizes are about half the size of the other participants. The functional network borders of the Cingulo-opercular (CON, purple) and Somato-cognitive action (SCAN, maroon) networks are displayed on the inflated surface rendering (top row). The freesurfer based anatomical borders of subcortical regions are overlaid on the horizontal slices.The putamen and thalamus are shown with white outlines (bottom row).

