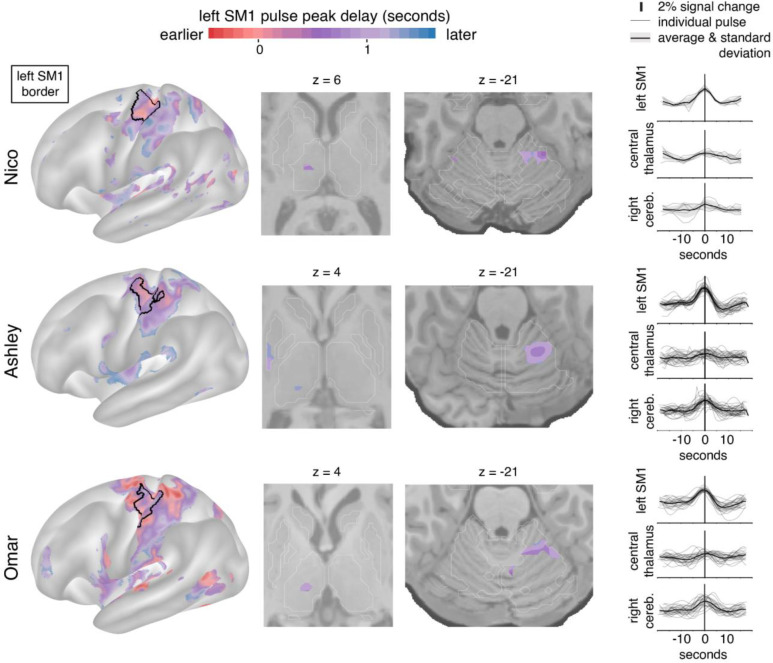
Figure 2: Disuse pulse distribution in cortex and subcortex.
The timecourse of each disuse pulse observed during casting was modeled using a Hemodynamic Response Function (HRF) (see Methods). The left hemisphere cortical surface (left), and subcortical axial slices (center: thalamic and cerebellar view) show where pulses were detected in each of the participants (Nico, top; Ashley, middle; Omar, bottom). The color scale spans 2 seconds bracketing the average left SM1ue pulse peak. The maps display the top 20th percentile of highest pulse detectability. The participant-specific upper extremity somatomotor region is outlined in black (left). On the right the individual (thin lines) and average (thick line) pulse timecourses are shown (y-axes: percent signal change) for the left SM1ue, the left thalamus and right cerebellum.

