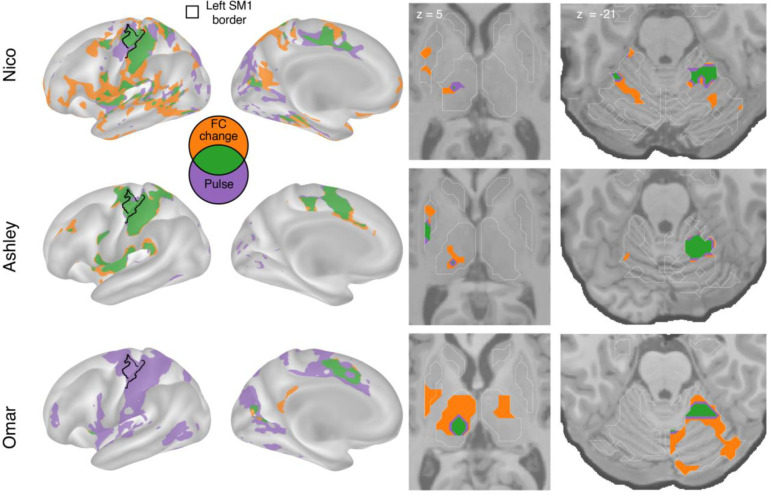
Figure 3: Spatial overlap of functional connectivity (FC) increases and disuse pulses.
The strongest disuse-driven FC increases (orange, Cast > Pre, cluster corrected) and disuse pulses (purple, top 20% threshold), as well as their overlap (green) are shown on the cortical surface (left), in the thalamus and putamen (middle) and the cerebellum (right). Results are displayed on the lateral left hemisphere surface, medial left hemisphere surface, and two axial slices (MNI z = 5 and −21). White borders on axial slices defined individual specific FreeSurfer based anatomical structures (z = 5: putamen, globus pallidus, caudate, thalamus; z = −21: cerebellum, hippocampus).

