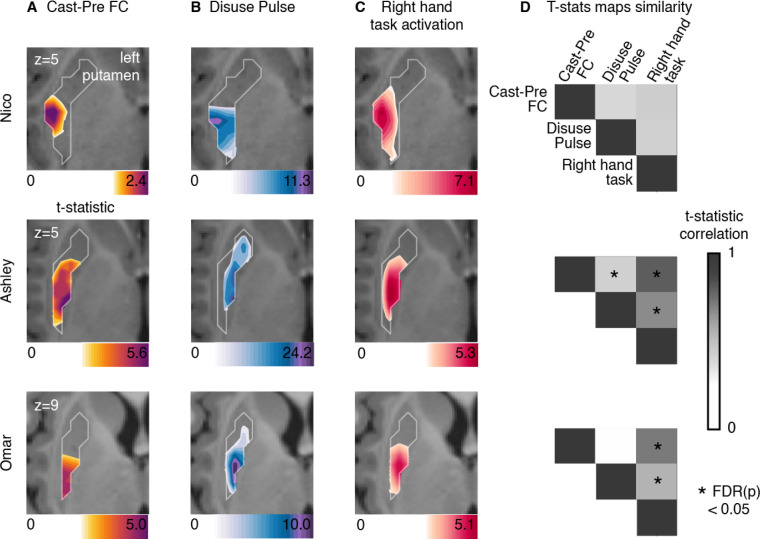
Figure 4: Putamen representations of disuse-driven FC changes, pulses and hand movement task fMRI activations.
(A) Map of disuse-driven increases in FC with the left SM1ue region of interest (top 30th percentile t statistics). (B) Map of disuse pulses (top 30th percentile t statistics). (C) Map of pre-casting task fMRI contrast: right hand movement vs baseline (top 30th percentile t statistics). For all three maps, color scales are represented at the bottom of the map with maximum value at 99.5th percentile. (D) Correlation between left putamen t statistic maps for disuse-driven FC increases, pulse and activation during hand movement (right hand vs baseline). Correlations between unthresholded t statistics maps were tested against individual-specific null distribution effects for each participant (top to bottom : Nico, Ashley, Omar). Reported significant p < 0.05 corrected for FDR (black *).

