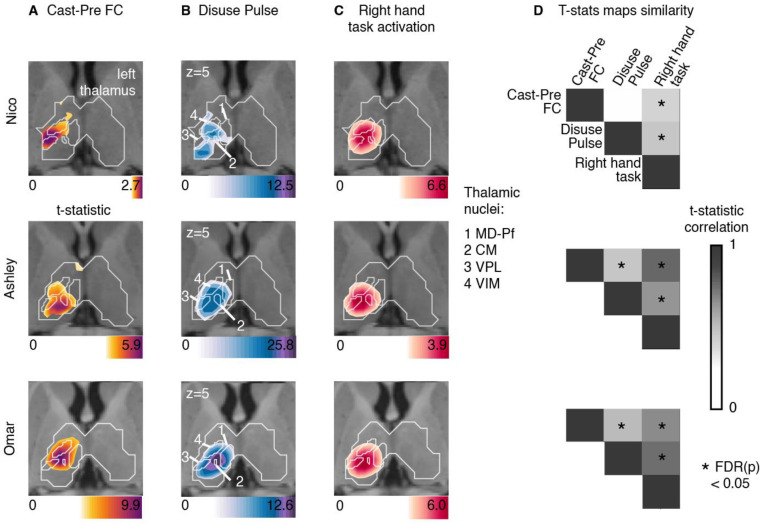
Figure 5: Thalamus representations of disuse-driven FC changes, pulses and hand movement task fMRI activations.
(A) Map of disuse-driven increases in FC with left SM1ue region of interest (top 30th percentile t statistics). (B) Map of disuse pulses (top 30th percentile t statistics). (C) Map of precasting task fMRI contrast : right hand movement vs baseline (top 30th percentile t statistics). For all three maps, color scales are represented at the bottom of the map with maximum value at 99.5th percentile. For all three maps, color scales are represented at the bottom of the map with maximum value at 99.5th percentile. Nucleus borders from the THOMAS individual-based segmentation overlapping with the effects are visible in white. Four nuclei are displayed : CM: centro-median , VPL: ventro-posterior lateral , VIM(VLPv): ventral intermediate (ventro-lateral posterior ventral), MD-Pf: medio-dorsal. Average t-statistics values for all thalamic nuclei are represented in bar plots (see figure S4) (D) Correlation between left thalamic t statistic maps for disuse-driven FC increases, pulse and activation during hand movement (right hand vs baseline). Correlations between unthresholded t statistics maps were tested against individual-specific null distribution effects for each participant (top to bottom : Nico, Ashley, Omar). Reported significant p < 0.05 corrected for FDR (black *).

