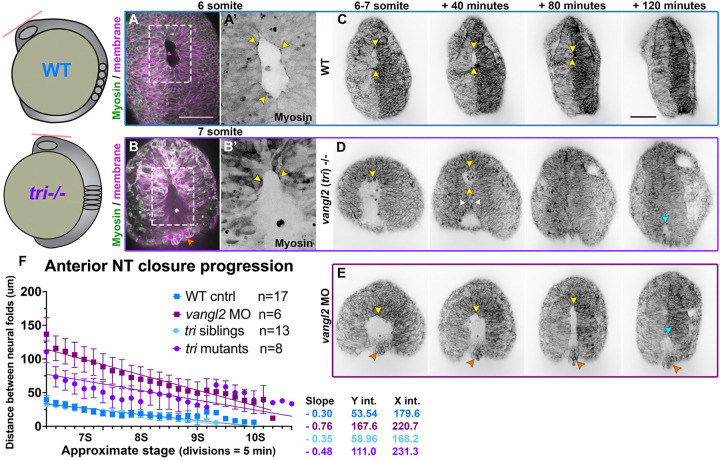
Figure 3. Neural fold fusion is delayed in vangl2 deficient embryos.
A-B’) Live images of the anterior neural tube of WT (A) and tri−/− (B) embryos expressing membrane Cherry (magenta) and the Sf9-mNeon Myosin reporter (green in A-B, black in prime panels) at the stages indicated. Areas in dashed boxed are enlarged in the prime panels depicting Sf9-mNeon only. Yellow arrows highlight Myosin localization to the edges of the anterior neural opening. Orange arrow shows cells protruding from the opening of tri−/− embryos. C-E) Still frames from time-lapse series of anterior neural tube development in WT (C), tri−/− mutant (D), and vangl2 morphant (E) embryos expressing membrane GFP or mCherry beginning at 6–7 somite stage, viewed dorsally. Yellow arrowheads indicate the anterior edge of the eye-shaped opening, white arrowheads indicate the pinch point, cyan arrowheads indicate the posterior opening, and orange arrowheads show cells protruding from the neural groove of vangl2 morphants. Each image series is a single Z plane from a confocal stack and is representative of multiple embryos of that condition (see n values for each condition in F). F) Distance between the bilateral neural folds over time in embryos of the conditions indicated, beginning when the eye-shaped opening forms at the 6-somite stage. Symbols are mean + SEM, lines are simple linear regressions, for which slopes and intercepts are provided. n values indicate the number of embryos measured of each condition from 2 independent vangl2 MO and 4 independent tri mutant trials. Anterior is up in all images, scale bars = 100 μm. See also Supp. videos 5, 8.

