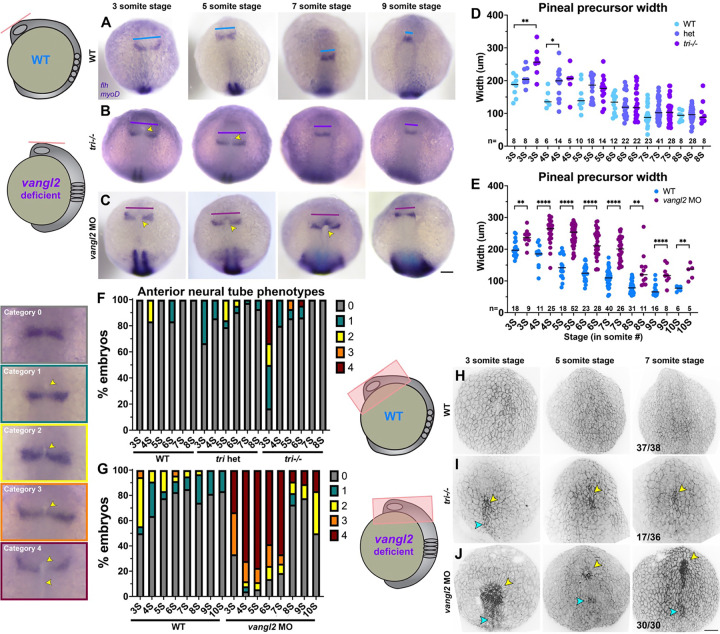
Figure 6. Fixed vangl2 deficient embryos exhibit apparent delayed pineal convergence and openings in the anterior neural plate.
A-C) Representative images of pineal precursors (flh WISH) and somites/adaxial cells (myoD WISH) in control (A), tri−/− mutant (B), and vangl2 MO-injected (C) embryos at the stages indicated, viewed dorsally. Blue, purple, and burgundy lines indicate pineal precursor width, yellow arrowheads indicate apparent openings in the anterior neural plate. D-E) Width of pineal precursor domains (as shown in A-C) in embryos from tri+/− incrosses (D) and in control (blue) and vangl2 morphant (burgundy) embryos (E) at the stages indicated. Each dot represents a single embryo, black bars are median values. n values indicate the number of embryos of each stage/condition measured from 3 independent trials, **p=0.005, *p=0.045, Welch’s ANOVA with Dunnett’s multiple comparisons (D), **p<0.01, ****p<0.0001, multiple T-tests (E). F-G) Percentage of tri+/− incross (F) or vangl2 morphant and control (G) embryos (as shown in A-C) at the stages indicated exhibiting the categories of anterior neural plate phenotypes shown on the left. n values as in D-E. H-J) 3-dimensional reconstructions of confocal Z-stacks through the anterior neural plate of fixed and phalloidin-stained embryos, viewed dorsally, of the stages and conditions indicated. Yellow arrowheads indicate apparent anterior openings, cyan arrowheads indicate openings in more posterior regions. Fractions indicate the number of embryos with the pictured phenotype over the number of embryos examined for each condition from 3 independent trials. Anterior is up in all images, scale bars = 100 μm.

