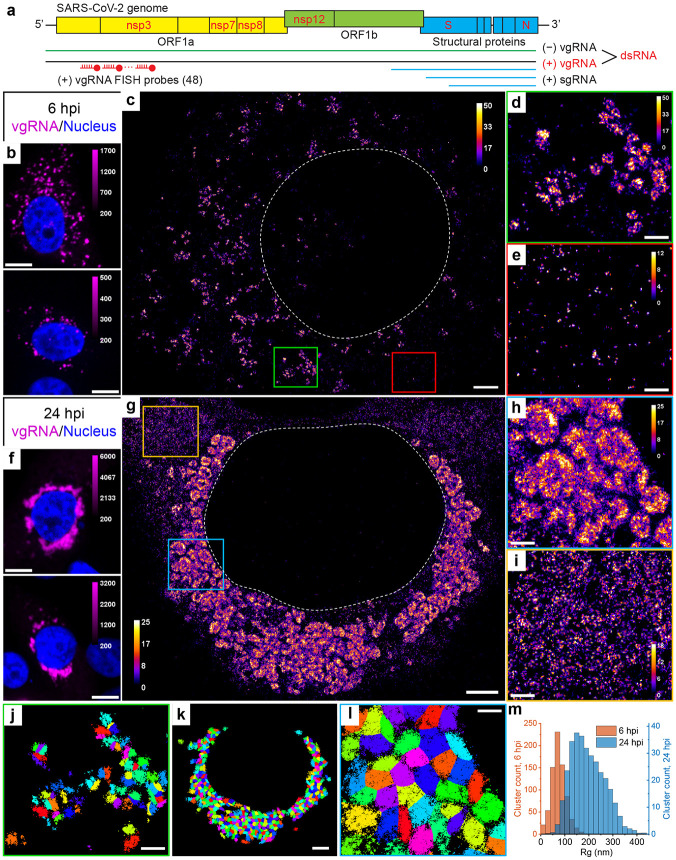
Fig. 1: Clustering of vgRNA in the cytoplasm of infected cells.
a, Scheme of SARS-CoV-2 genome with constructs used for its detection in infected cells. 48 antisense DNA oligonucleotide probes were used to target the ORF1a-coding region of vgRNA that is exclusive to the positive-sense vgRNA and does not occur in the sgRNAs. The RNA FISH probes are conjugated with AF647 or CF568. b, Representative confocal images of vgRNA in infected Vero E6 cells at 6 hpi display scattered diffraction-limited (DL) puncta. c, Representative SR image of an infected cell at 6 hpi reveals distinct vgRNA clusters in the cytoplasm. d, Zoomed-in region of the SR image (green frame in c) displays an agglomeration of vgRNA clusters. e, Zoomed-in region of the SR image (red frame in c) shows nanoscale puncta of individual vgRNA molecules. f, Representative confocal images of vgRNA in infected Vero E6 cells at 24 hpi display large DL foci in the perinuclear region of the cytoplasm. g, Representative SR image of an infected cell at 24 hpi reveals large perinuclear vgRNA clusters. h, Zoomed-in region of the SR image (blue frame in g) displays dense vgRNA clusters. i, Zoomed-in region of the SR image (yellow frame in g) displays nanoscale puncta of vgRNA molecules. j, BIC-GMM cluster analysis of the region shown in d. k, BIC-GMM cluster analysis of the cell shown in g. l, BIC-GMM cluster analysis of the region shown in h. m, Histogram of the radii of gyration (Rg) of the vgRNA clusters indicate their size increase between 6 hpi (magenta) and 24 hpi (green). Scale bars, 10 μm (b, f), 2 μm (c, g, k), 500 nm (d, e, h, i, j, l). Dashed lines in c and g indicate the boundary of the cell nucleus (large dark region). Localizations that belong to the same cluster in j, k, l are depicted with the same color, but colors are reused. Color bars in c, d, e, g, h, i show the number of single-molecule localizations within each SR pixel (20 x 20 nm2).

