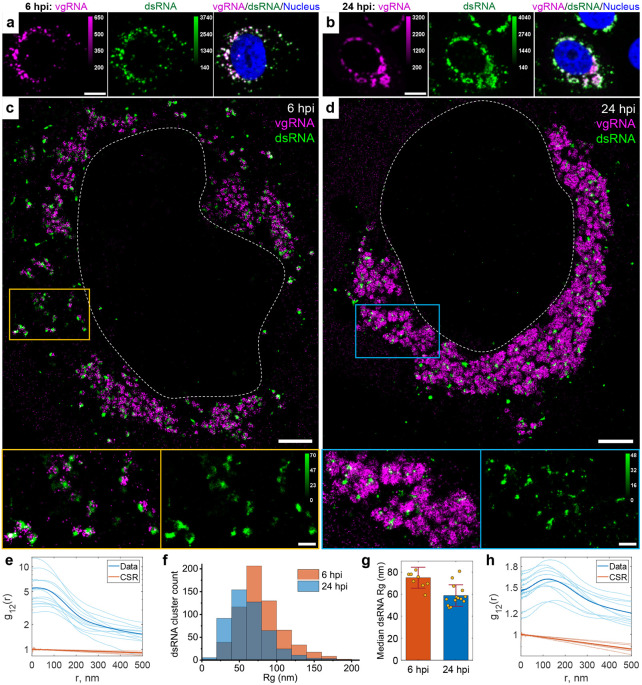
Fig. 2: Association of dsRNA with vgRNA clusters.
a-b, Representative confocal images of SARS-CoV-2 infected cells display DL colocalization between dsRNA (green) and vgRNA (magenta) at both 6 hpi (a) and 24 hpi (b). c-d, Representative SR images of SARS-CoV-2 infected cells indicate association between dsRNA and vgRNA at 6 hpi (c) and short-range anti-correlation often with concentric localization at 24 hpi (d). Bottom panels, zoomed-in images of corresponding colored boxes. e, Bivariate pair-correlation functions g12(r) calculated between the localizations of dsRNA and vgRNA indicate their close association at 6 hpi. f, Histogram of Rg of dsRNA clusters as determined by the BIC-GMM cluster analysis. g, Median Rg of dsRNA clusters per cell significantly decreases between 6 hpi and 24 hpi. p-value = 8·10−4, two-tailed t-test. Error bars represent mean ± standard deviation of median Rg values of dsRNA clusters in individual cells. h, Bivariate pair-correlation functions g12(r) reveal nanoscale anti-correlation between dsRNA and vgRNA at 24 hpi. CSR, complete spatial randomness. Thin lines correspond to g12(r) of individual cells and bold lines are the mean values of g12(r) from all analyzed cells. Scale bars, 10 μm (a-b), 2 μm (c-d), 500 nm (c-d, bottom panels). Dashed lines in c and d indicate the boundary of the cell nucleus.

