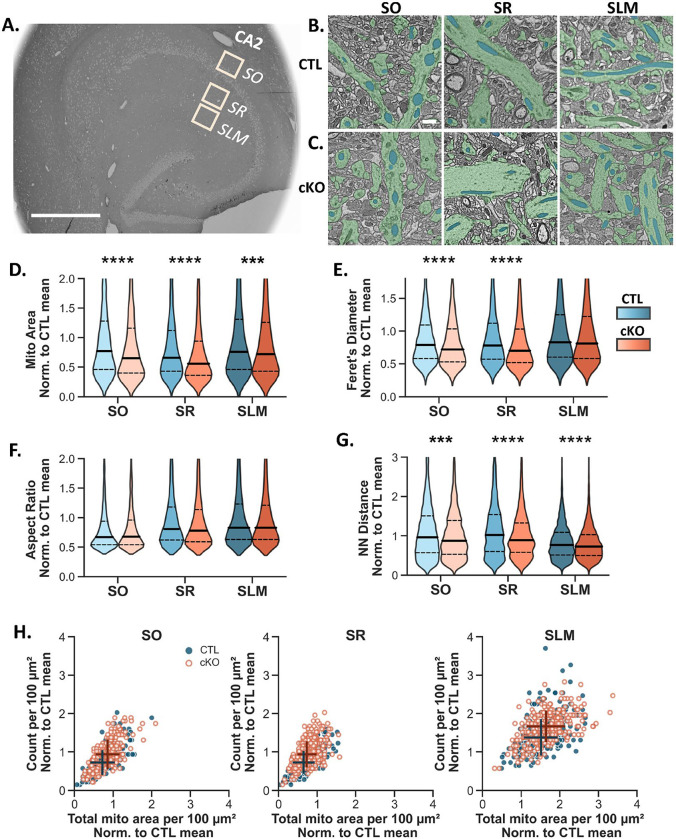
Figure 4: Dendritic mitochondria in MCU cKO mice are smaller and more numerous than CTL mice.
A. Representative scanning electron microscopy (SEM) overview image of a horizontal hippocampal section with the large ROIs representing the sampling areas from CA2 SO, SR and SLM that were quantified. Scale = 600 μm.
B. Representative SEM images from CA2 SO, SR, and SLM of the CTL group, showing dendritic mitochondria (blue) and dendrites (green). Scale = 1 μm for B-C
C. Representative SEM images from CA2 SO, SR and SLM of the MCU cKO group.
D. Violin plots of individual mitochondrial area in 100 μm2 image tiles from CA2 SO, SR and SLM in CTL (blue) and cKO mice (orange). All plots were normalized to the overall mean of the CTL. Two-way ANOVA, significant overall effect of genotype F (1, 23653) = 49.06, p < 0.0001; significant overall effect of layer F (2, 23653) = 131.67, p < 0.0001; interaction F (2, 7) = 7.04, p < 0.001; Mann Whitney post hoc tests comparing genotypes are shown on the plot; CTL SO n = 2353, CTL SR n = 2904, CTL SLM n = 5236. cKO SO n = 2860, cKO SR = 4007, cKO SLM = 6299, n = mitochondria). Solid line = median; dashed line = upper and lower quartiles.
E. Violin plots of mitochondria Feret’s diameter normalized to the overall mean of the CTL from the same dataset in (D). Two-way ANOVA, significant overall effect of genotype F (1, 23653) = 25.47, p < 0.0001; significant overall effect of layer F (2, 23653) = 162.55, p < 0.0001; interaction F (2, 23653) = 4.15, p < 0.05; Mann Whitney post hoc tests comparing genotypes are shown on the plot.
F. Violin plots of mitochondria aspect ratio normalized to the overall mean of the CTL from the same dataset in (D). Two-way ANOVA, significant overall effect of layer F (2, 23653) = 203.19, p < 0.0001 but no overall effect of genotype F (1, 23653) = 0.566, p > 0.05. See Supplemental Fig 2 for CTL layer pairwise comparisons.
G. Violin plots of mitochondria nearest neighbor distance normalized to the overall mean of the CTL from the same dataset in (D). Two-way ANOVA, significant overall effect of genotype F (1, 23653) = 109.63, p < 0.0001; significant overall effect of layer F (2, 23653) = 570.00, p < 0.0001; interaction F (2, 23653) = 14.83, p < 0.0001; Mann Whitney post hoc tests comparing genotypes are shown on the plot.
H. A correlation plot comparing mitochondrial count and total mitochondrial area per 100 μm2 image tile in CA2 SO, SR, and SLM in CTL (closed blue dots) and MCU cKO (open orange dots). Mitochondria count and total mitochondria area were separately normalized to the overall mean of the CTL. Overall effect of genotype was significant for count (two-way ANOVA, overall effect of genotype F (1, 1551) = 105.47, p < 0.0001; significant overall effect of layer F (2, 1551) = 590.35, p < 0.0001, CTL SO n = 223, CTL SR n = 279, CTL SLM n = 260. cKO SO n = 218, cKO SR = 298, cKO SLM = 279, n = 100 μm2 tiles) and total area (two-way ANOVA, overall effect of genotype F (1, 1551) =27.06, p < 0.0001; significant overall effect of layer F (2, 1551) = 976.34, p < 0.0001). The cross indicates the median of the respective group with horizontal and vertical lines indicating the standard deviation for each axis.

