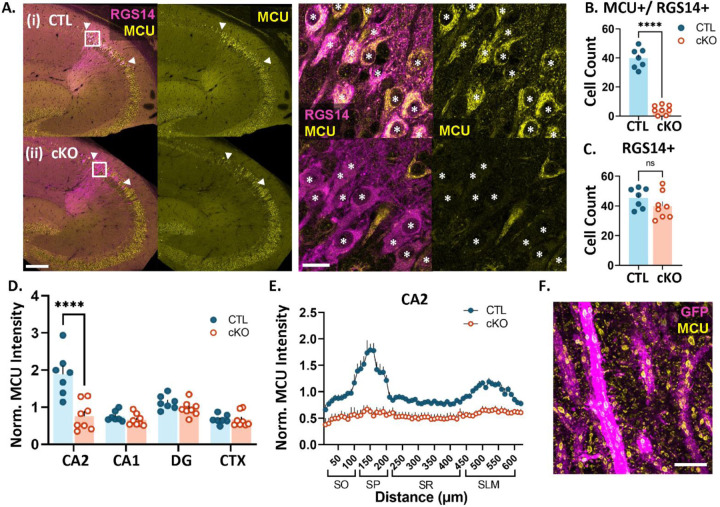
Fig. 1: MCU expression is significantly reduced in CA2 neurons of cKO mice.
A. Representative images of RGS14 (magenta) and MCU (yellow) immunostaining in CTL (i) and cKO (ii) mice. Right: Higher magnification images of CA2 neurons. Asterisks indicate RGS14-positive CA2 neurons.
B. Quantification of the number of RGS14+ CA2 neurons per section expressing MCU (CTL: 39.8 ± 2.6 neurons, N=7 mice, cKO: 4.3 ± 1.1 neurons, N=8 mice, two-tailed unpaired t-test, p<0.0001)
C. The total number of RGS14-positive CA2 neurons per section does not differ between CTL and cKO mice (CTL: 45.4 ± 2.6 neurons, cKO: 39.9 ± 3.1, two-tailed unpaired t-test, p= 0.204)
D. MCU fluorescence intensity in CTL and cKO mice in CA2, CA1, dentate gyrus (DG) and neighboring cortex (CTX). Data were normalized to the CTL average. (two-way ANOVA, overall effect of genotype F (1, 52) = 22.45, p<0.0001; overall effect of subregion F (3, 52) = 17.80, p<0.0001, interaction F (3, 52) = 12.74, p<0.0001; sidak’s post hoc test CTL v. cKO CA2 p<0.0001).
E. Line plot analysis of MCU fluorescence intensity across CA2 layers in CTL and cKO mice. Data are normalized to the CA2 CTL average.
F. Representative super resolution image of MCU (yellow) in genetically labeled CA2 dendrites (magenta) using expansion microscopy (ExM). Scale = 200 μm and 25 μm (A) and 5 μm, ExM adjusted (F). ****p<0.0001

