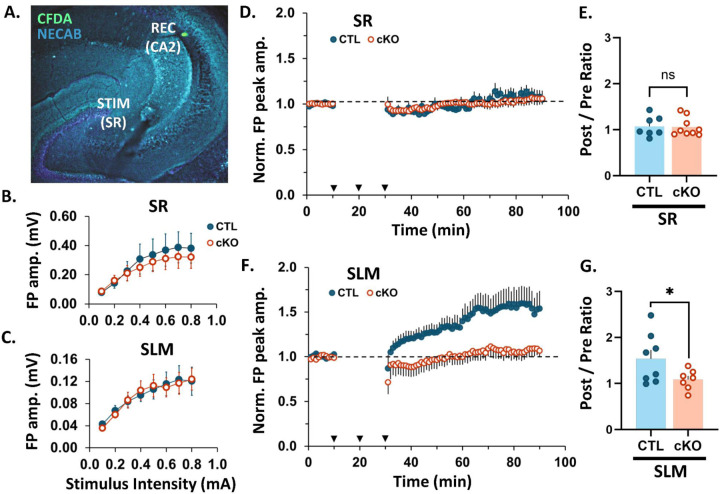
Fig. 2: CA2 MCU cKO blocks LTP in CA2 SLM, with no effect in plasticity-resistant CA2 SR.
A. Representative image of the recording and stimulating site in an acute hippocampal slice. CFDA dye (green) was pressure ejected from the recording pipette. NECAB staining (cyan) delineates CA2.
B. Input-output curve showing the relationship between field potential amplitude and stimulus intensity after stimulation of SC inputs to SR of CTL (blue, closed) and cKO slices (orange, open). No significant difference in response amplitude at any stimulus intensity between CTL and CKO slices with t-test. N = 7 CTL, 9 cKO slices.
C. Input-output curve after stimulation of PP inputs to SLM of CTL and cKO slices. No significant difference in response amplitude at any stimulus intensity between CTL and CKO slices with t-test. N = 8 CTL, 7 cKO slices.
D. Average time plot of normalized field potential peak amplitudes evoked in CA2 by stimulation of SC inputs to SR of CTL and MCU cKO slices. N = 7 CTL, 9 cKO slices. Dotted black line = baseline (all plots). Error bars = SEM (all plots). Arrow heads = stimulation at 100 Hz for 1s; 3 bursts with 10 min interval.
E. Post/pre ratio of normalized field potential peak amplitudes evoked in CA2 by stimulation of SC inputs to SR of CTL and cKO slices. One-tailed Welch’s t-test; N = 7 CTL, 9 cKO slices.
F. (I.) Average time plot of normalized field potential peak amplitudes evoked in CA2 by stimulation of PP inputs to SLM of CTL and MCU cKO slices. N = 8 CTL, 7 cKO slices.
G. Post/pre ratio of normalized field potential peak amplitudes evoked in CA2 by stimulation of PP inputs to SLM of CTL and cKO slices. One-tailed Welch’s t-test; N = 8 CTL, 7 cKO slices. ns = p < 0.05; * p > 0.05.

