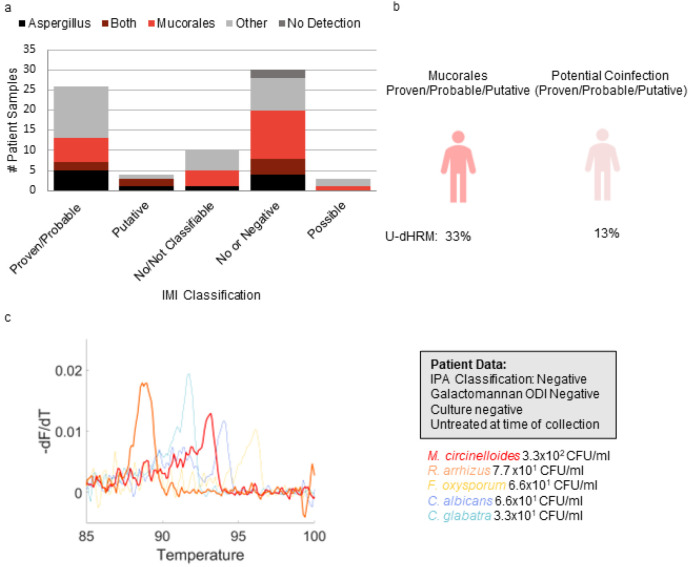
Figure 7. Mucorales detection.
a) Aspergillus and Mucorales detection distribution by IMI diagnosis classification. Others are defined as yeasts in the U-dHRM database or unknown novel organisms b) U-dHRM detection of mucorales and potential co-infection in suspected IMI cases. c) Discordant mold diagnosis example of representative raw clinical curves demonstrating patient BALF pathobiome. Curves are shown for. Mucor, Fusarium, and Candida for visualization purposes with the following quantifications: 6.6x101 CFU/mL C. albicans (blue) 3.3x10 CFU/mL C. glabrata (blue), 3.3x10² CFU/mL M. circinelloides (red), 7.7x10 CFU/mL R. arrhizus (orange), 6.6 x101 CFU/mL F. oxysporum, and 1.2x10² novel organisms (not shown)

