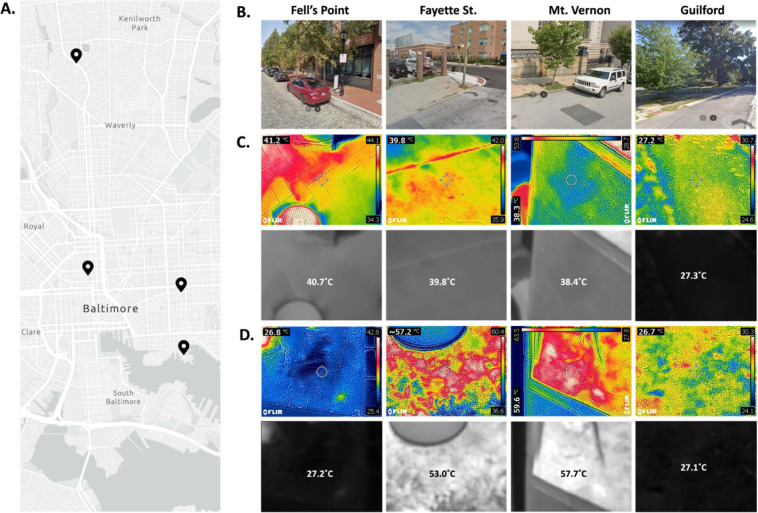
Figure 2. Thermal Properties of Sampling Sites in Baltimore, MD.
A. Map of the four sites sampled in Baltimore, MD (counter-clockwise from the bottom: Fell’s Point, Fayette, Guilford, Mt. Vernon). B. Google StreetView images from the sampling sites taken during summer months in recent years. Infrared images of the sidewalks (C) and dirt (D) on August 20th, 2023 with visible light photo overlayed (top rows), and the raw temperature image standardized to 27°C (min) and 60°C (max) with the average temperature measured overlayed (bottom rows).

