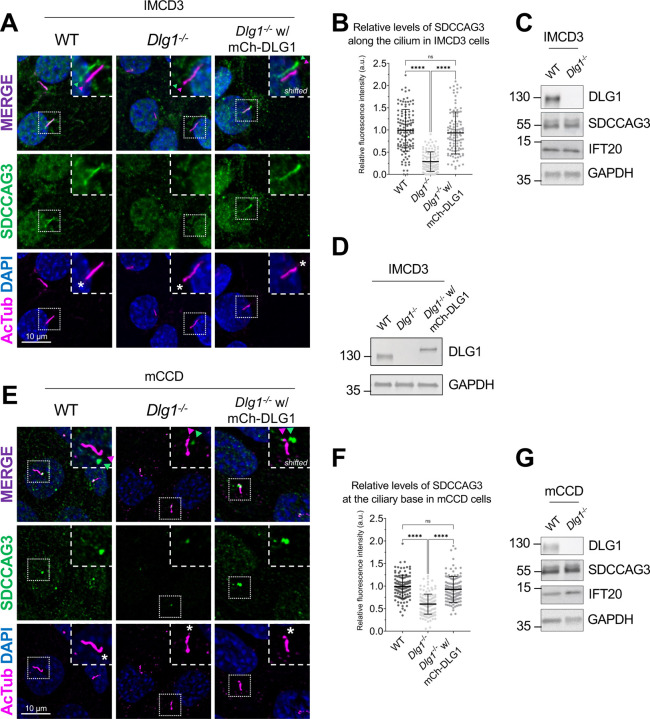
Figure 3. Loss of DLG1 impairs ciliary localization of SDCCAG3 in IMCD3 and mCCD cells.
(A, E) IFM analysis of ciliated cilia-BioID2 IMCD3 (A) and mCCD (E) cell lines showing comparative SDCCAG3 staining (green) in WT, Dlg1−/− and mCherry-DLG1 (mCh-DLG1) rescue cells. Cilia were stained with antibodies against acetylated α-tubulin (AcTub, magenta), and nuclei visualized with DAPI staining (blue). Insets show enlarged images of cilia, asterisks mark the ciliary base. The merged insets show primary cilia with channels shifted to aid visualization. (B, F) Quantification of the relative mean fluorescence intensity (MFI) of SDCCAG3 staining along the cilium of cilia-BioID2 IMCD3 cell lines (B) or at the ciliary base of mCCD cell lines (F). Graphs represent WT normalized and accumulated data (n=3). Kruskal-Wallis test with Dunn’s multiple comparison test was used for the statistical analysis. (C, D, G) Western blot analysis of total cell lysates of cilia-BioID2 IMCD3 (C, D) or mCCD (G) cell lines. Blots were probed with antibodies as indicated, GAPDH was used as loading control. Molecular mass markers are shown in kDa to the left.

