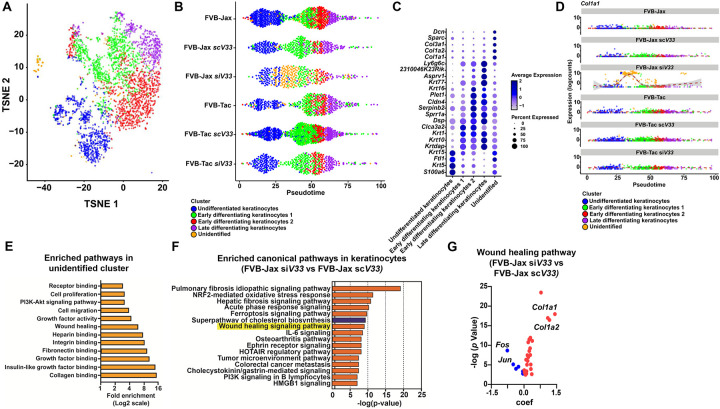
Figure 4: Impact of tick EVs on wound healing circuitry.
(A) Composite tSNE plot of keratinocytes in FVB-Jax and FVB-Tac mice in the presence or absence of I. scapularis nymphs microinjected with scV33 or siV33. (B) Cells colored by clusters originated from the keratinocyte tSNE plot (as shown in A) ordered across pseudotime (x-axis) for naïve, scV33-, and siV33-tick bites of FVB-Jax and FVB-Tac mice. (C) Dot plot of the top 5 marker genes present in the keratinocyte clusters (as shown in A). Average gene expression is demarked by the intensity of color. Percent of gene expression within individual clusters is represented by the dot diameter. (D) Expression of Col1a1 across treatments ordered across pseudotime (x-axis) for naïve, scV33-, and siV33-tick bites of FVB-Jax and FVB-Tac mice. (E) Enriched pathways in the unidentified cell cluster based on functional annotation in DAVID. Fold enrichment is indicated in a Log2 scale. *p value and false discovery rate (FDR)<0.05 were set as threshold. KEGG, GO and InterPro were used as reference annotation databases. (F) Ingenuity pathway analysis comparing keratinocytes of skin biopsies from FVB-Jax siV33 to FVB-Jax scV33. Blue denotes pathways predicted to be inhibited (negative z-score) whereas orange indicates pathways predicted to be activated (positive z-score) based on default parameters. Differential expression datasets were assessed for canonical pathway analysis. Results are shown in a −log (p-value) scale. *p value and FDR< 0.05 were set as threshold. (G) Volcano plot of genes representing the wound healing signaling pathway in keratinocytes of FVB-Jax siV33 compared to FVB-Jax scV33 datasets (highlighted in yellow; F). Blue denotes decrease whereas red indicates increase in the coefficient (coef) of expression.

