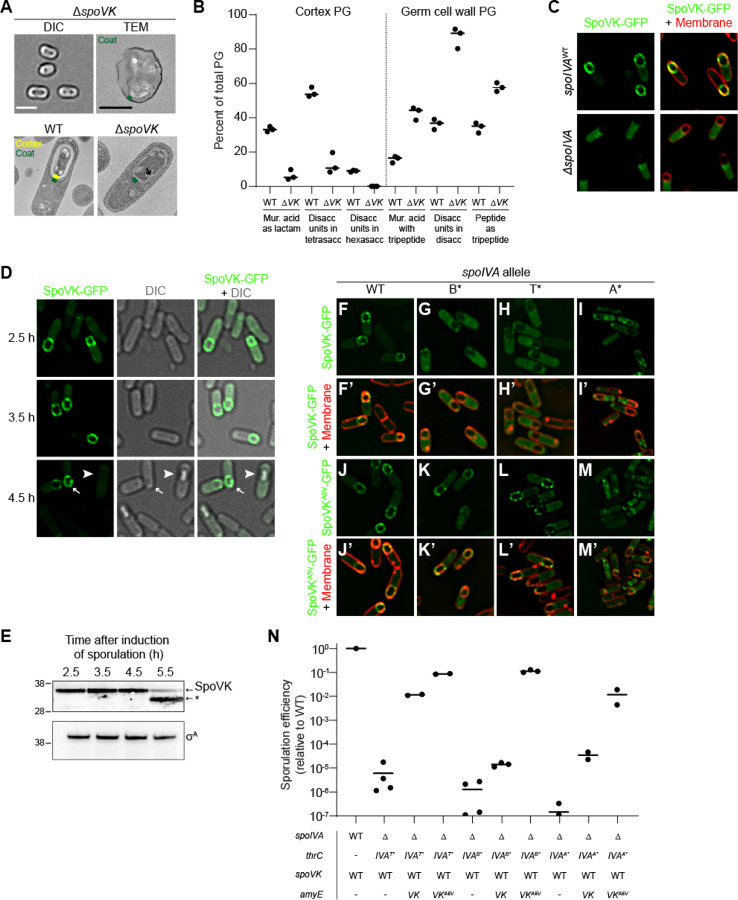
Figure 2. SpoVK is an ephemeral sporulation protein.
(A) DIC light microscopy (left; size bar: 2 μm) or TEM images (F; size bar: 500 nm) of released spores (top panels) containing deletion of spoVK (strain TD520). Bottom panels: TEM images of WT (left) or spoVK deletion strain at 5.5 h after induction of sporulation. Green in the TEM images indicates coat; yellow indicates cortex. (B) Structural parameters of spore peptidoglycan produced by WT or ΔspoVK (strains PY79 and TD520, respectively). Peptidoglycan from developing spores was extracted 5 h after induction of sporulation, digested with mutanolysin, and separated by HPLC. Peaks of select muropeptides that are characteristic cortex or germ cell wall were integrated and depicted as a percent of total peptidoglycan (see Table S1 for complete analysis). Bars represent mean; data points represent an independent culture. (C) Subcellular localization of SpoVK-GFP in presence (top panels) or absence (bottom panels) of spoIVA 3.5 h after induction of sporulation (strains TD604 and TD652). Left: fluorescence from SpoVK-GFP; right: overlay of GFP fluorescence (green) and FM4–64 (red). (D) Subcellular localization of SpoVK-GFP at the indicated (left) time points after the induction of sporulation. Left panels: fluorescence from SpoVK-GFP; center: DIC; right: overlay of fluorescence and DIC. Arrowhead indicates a phase bright forespore; arrow indicates phase gray forespore (strain TD604). (E) Immunoblot of cell extracts of sporulating wild type B. subtilis (strain PY79) using anti-SpoVK or anti-σA antisera, from cells harvested 2.5 h, 3.5 h, 4.5 h, and 5.5 h. Relative mobility of molecular weight markers (kDa) indicated to the let; asterisk indicates a likely degradation product of SpoVK. (F-M’) Subcellular localization of (F-I’) SpoVK-GFP or (J-M’) SpoVKA5V-GFP in the presence of (F-F’; J-J’) SpoIVAWT or (G-M’) SpoIVA variants that fails to polymerize (IVAB*, IVAT* or -IVAA*) 3.5 h after the induction of sporulation (strains: TD675, TD682, TD684, and TD836). (F-M) GFP fluorescence; (F’-M’) overlay, GFP fluorescence and FM4–64. (N) Sporulation efficiencies, determined as resistance to heat, relative to WT (PY79). Strain genotypes at spoIVA and spoVK loci are indicated below the graph; thrC and amyE are ectopic chromosomal loci used to complement spoIVA and spoVK deletions, respectively, with different alleles of those genes. Bars represent mean values; data points represent an independent culture (Strains PY79, JPC221, TD563, TD564, JPC75, TD557, TD558, KR438, TD859, and TD860).

