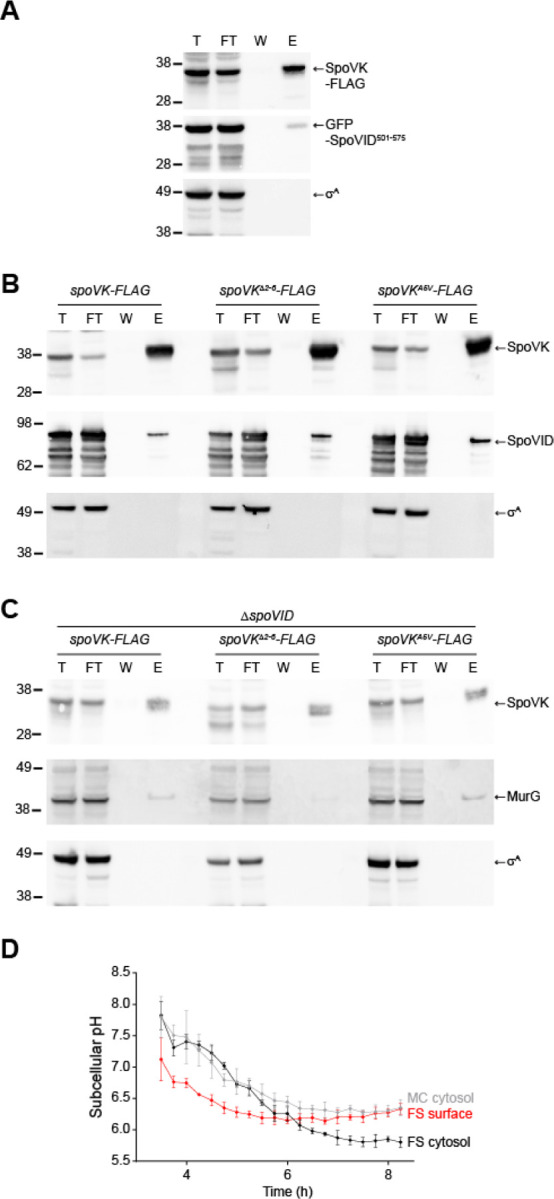
Figure 5. SpoVK interacts with SpoVID and MurG at an acidified forespore surface.

(A) Immunoblots of total (T), flow through (FT), wash (W), and elution (E) fractions of the SpoVKB*-Flag immunoprecipitation from cells producing GFP-SpoVID501−575 (containing the SpoVID LysM domain) harvested 4h after the induction of sporulation with anti-Flag magnetic beads using anti-SpoVK, anti-GFP, or anti-σA antisera. Strain: TD1281. (B-C) Immunoblots of fractions described above, of the SpoVKB*-Flag immunoprecipitation (left), SpoVKB*-Flag with residues 2–5 deleted (middle), or SpoVKB*-Flag harboring the A5V substitution from cells that either (B) produce or (C) do not produce SpoVID, using anti-SpoVK, anti-SpoVID, or anti-σA antisera. Strains: TD1267, TD1277, TD1283, TD1268, TD1278, and TD1284. (D) Subcellular pH measurements in a sporangium near the producing IpHluorin fusions to SpoVM (to measure the forespore surface, “FS surface”, red), or free IpHluorin produced in the mother cell cytosol (“MC cytosol”, gray), or forespore cytosol (“FS cytosol”, black) taken at indicated time points after induction of sporulation. pH values were obtained by measurement of the emission fluorescence at 510 nm after excitation at 390 nm and 470 nm. After obtaining the emission ratio of 390 nm/470 nm, pH was calculated using a calibration curve obtained by growing IpHluorin-producing cells in media of defined pH in the presence of an electrochemical gradient dissipator. Data points represent mean of 4 independent biological replicates; errors are S.D. Strains: SC765, SC767, and SC766.
