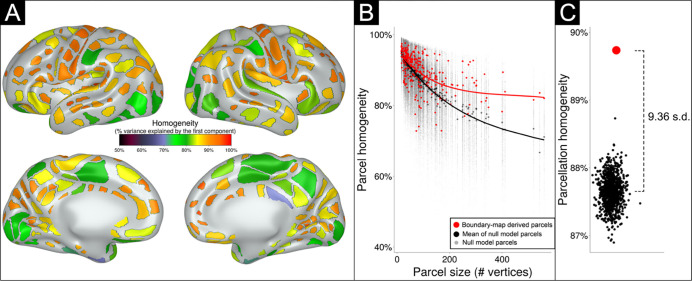
Figure 3: The parcellation generated from the primary dataset (n=131) shows 283 highly homogenous parcels at 50% height threshold.
A) Parcels are colored based on homogeneity value, calculated based on percent variance explained by the first principal component of the connectivity patterns of the individual vertices comprising each parcel. B) The homogeneity of each parcel (red dots) is plotted as a function of parcel size. Black dots indicate the homogeneity of each parcel over 1000 null rotations. Note that many parcels had true homogeneity values higher than the average of null rotations, especially larger parcels. C) The performance of the entire parcellation scheme tested against 1000 null rotations. The black dots indicate the average homogeneity value across all 283 parcels for each of the 1000 null rotations. The red dot represents the average homogeneity value across all 283 parcels in the true data. The average homogeneity across all parcels was 9.36 standard deviations above the mean of the null rotations.

