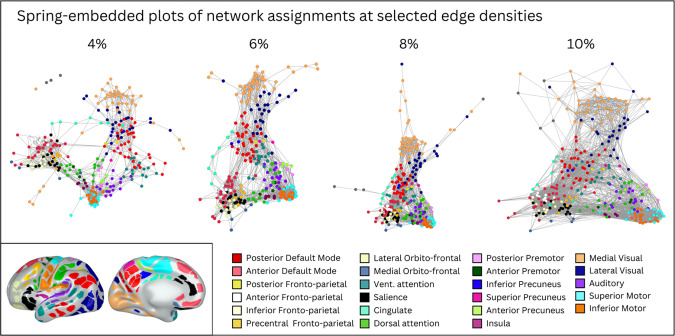
Figure 6: Spring embedded plots of neonatal parcels across different edge densities reveal neonatal network properties.
A spring embedded layout of neonatal functional connections at various edge densities between 4% and 10%. Each colored circle corresponds to a particular parcel, colored based on consensus network assignment. Lines represent functional connections between parcels at a given edge density (e.g., at 4% edge density, only the top 4% of positive functional connections are shown). In the spring-embedded representation, stronger connections tend to pull parcels closer together, and so the proximity of parcels to each other is related to their inter-connectivity. Note that when only considering the strongest connections (e.g., 4%), parcels cluster mainly by network (color) and anatomical location (e.g., frontal networks are all near each other); but when considering weaker connections (e.g., 10%), there is some evidence of selective connections between anatomically distant parcels that end up forming the same adult network (e.g., the red and watermelon parcels draw close to each other; these parcels may be precursors of the adult default mode network). Inset shows consensus network assignment of each parcel for reference (identical to Figure 5).

