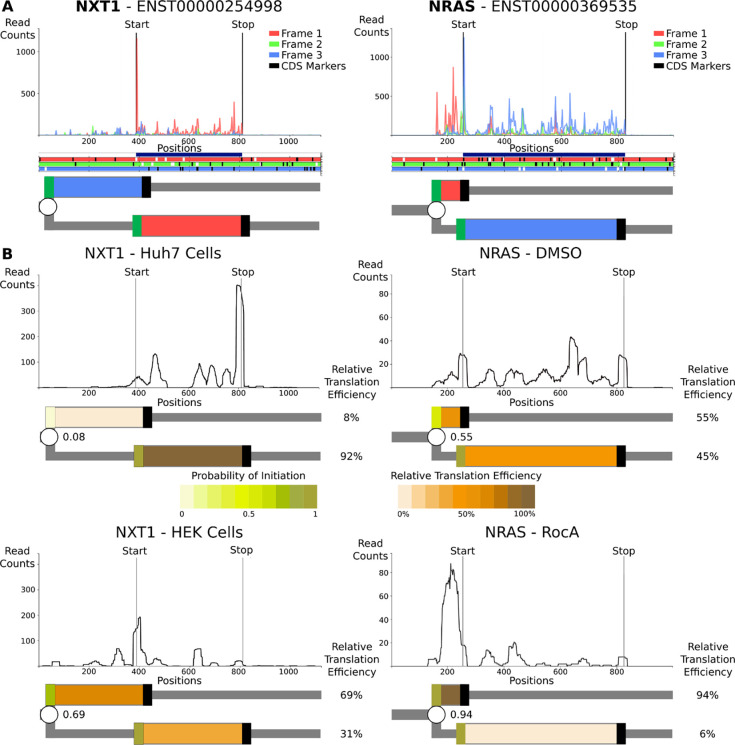
Figure 5: Representation of translation of human mRNAs.
A. The top plots are A-site subcodon footprint densities for NXT1 and NRAS mRNAs coloured to match the best-supported reading frame below in the ORF plots, in which AUGs are in white and stops are in black. Further below are RDG representations with translons coloured to match the translated frame. The CDS starts are treated deterministically and unproductive RiboPaths are not shown. B. Densities of ribosome A-site footprints obtained from ribosome profiling under different conditions (NRAS) or from different cells (NXT1). RDGs are shown below each density plot with translons coloured as a heatmap reflecting relative translation efficiencies. Branching points (starts) are also coloured as heatmaps reflecting the inferred probability of their initiation. The probabilities of translation initiation are shown as fractions decimals, while the relative translation efficiencies of each path are shown as percentages (%).

