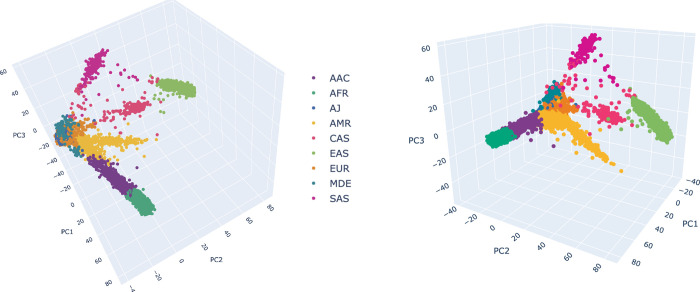
Figure 1. Ancestry prediction clustering for samples genotyped on the NeuroBooster array.
3 dimensional principal components analysis to group individuals based on their genetic makeup. A total of 2,793 samples from the Global Parkinson’s Genetics Program were included, including 2,373 Parkinson’s disease cases and 420 Gaucher disease cases. Each point represents a sample and the colors depict the ancestral background as shown in the color legend: EUR = orange, EAS = lemon green, AMR = yellow, AJ = lapis blue, AFR = teal blue, AAC = purple, SAS = magenta, CAS = dark pink, MDE = cerulean blue. EUR (Europe), EAS(East Asian), AMR (Latino/Admixed American), AJ (Ashkenazi Jewish), AAC (African-Admixed), AFR (African), SAS (South-Asian), CAS (Central-Asian), MDE (Middle East).

