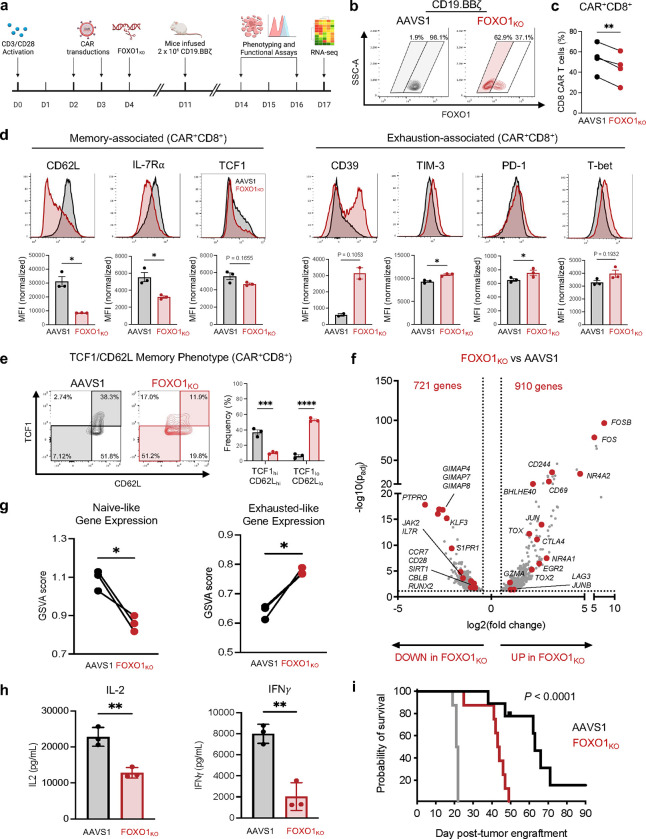
Figure 1: CRISPR knockout of human FOXO1 impairs memory formation and antitumor function in CAR T cells.
a, Schematic depicting generation of FOXO1 knockout (FOXO1KO) CD19.BBζ CAR T cells and downstream assays. b, Gating strategy for flow cytometric analysis of AAVS1-edited controls (AAVS1) and FOXO1KO cells. All samples were gated on live CAR+ cells. AAVS1 cells (left) were analyzed regardless of FOXO1 expression level (gray shading) and FOXO1KO cells (right) were gated on the FOXO1 negative subpopulation (red shading). c, Percent CD8+ AAVS1 and FOXO1KO CD19.BBζ CAR-T cells at day 16 post-activation (n = 4 independent donors). d, Flow cytometric analysis of memory- (left) and exhaustion-associated markers (right) on CD8+ CD19.BBζ CAR T cells edited for AAVS1 (black) FOXO1 (red) and gated as in (b). Histograms show a representative donor; bar graphs depict mean ± s.e.m. of 3 independent donors. e, Contour plots showing memory marker expression and frequency in CD8+ CD19.BBζ CAR T cells edited for AAVS1 (black) or FOXO1 (red) and gated as in (b). Representative contour plots from one donor show TCF1hiCD62Lhi (memory) and TCF1loCD62Llo (effector) subpopulations; bar graphs show mean ± s.e.m. for 3 independent donors. f, Volcano plot of differentially expressed genes (DEGs) in CD62Llo FOXO1KO versus AAVS1 CD19.BBζ CAR T cells from 3 independent donors (adjusted P < 0.05 with log2(fold change) > 0.5). Genes of interest are highlighted in red. g, Gene set variation analysis (GSVA) using naive and exhausted T cell gene signatures from Andreatta et al66. h, Day 14 IL-2 and IFNγ secretion in response to Nalm6 leukemia. Error bars represent mean ± s.d. of triplicate wells from one representative donor (n = 4 independent donors). i, Kaplan-Meier curves depicting survival of mice challenged with Nalm6 and treated with mock (grey), AAVS1 (black), or FOXOKO (red) CD19.BBζ CAR T cells. Two independent donors were tested with 3–5 mice per group (n = 8 mock or FOXO1KO mice, n = 9 AAVS1 mice). c,d,g, Paired two-sided student’s t-test. e, Two-way ANOVA with Bonferroni’s multiple comparisons test. h, Unpaired two-sided Welch’s t-test. i, Log-rank Mantel-Cox test. *, P < 0.05; **, P < 0.01; ***, P < 0.001; ****, P < 0.0001.

