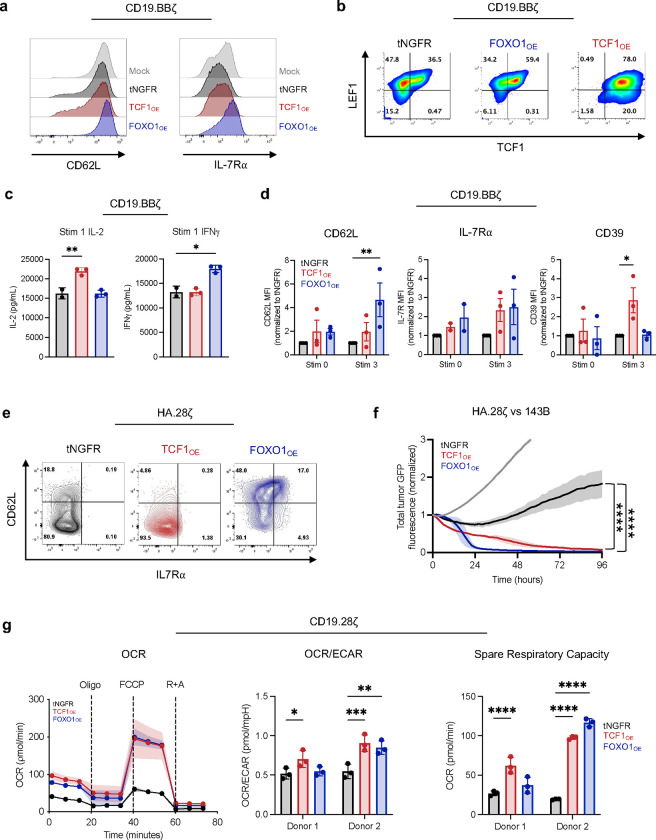
Extended Data Fig 3: FOXO1 overexpression promotes a memory phenotype and mitigates exhaustion in CAR T cells.
a, CD62L and IL-7Rɑ expression in CD19.BBζ CAR T cells from one representative donor (n = 4 donors). b, TCF1 and LEF1 in expression in CD19.BBζ CAR T cells from one representative donor (n = 4 donors). c, IFNγ and IL-2 secretion from CD19.BBζ CAR T cells challenged with Nalm6 leukemia (n = 2–3 donors). d, Expression of memory- and exhaustion-associated markers on tNGFR-purified CD8+ CD19.BBζ CAR T cells before the first stimulation (left, pre-stim) and 7 days after the third stimulation (right, Stim 3). Graphs show mean ± s.e.m. of tNGFR-normalized mean fluorescence intensity from 2–3 donors. e, CD62L and IL7Rɑ in HA.28ζ CAR T cells. Contour plots show a representative donor from n = 5 donors. f, Cytotoxicity of HA.28ζ CAR T cells against 143B osteosarcoma cells (1:8 E:T, normalized to t = 0). Graphs show mean ± s.d. of 3 triplicate wells from one representative donor (n = 3 donors). g, Metabolic flux of CD19.28ζ CAR T cells measured by Seahorse XF analyzer (n = 2 donors). Plots show oxygen consumption rate (OCR) over time (left) from one representative donor, and ratio of OCR to extracellular acidification rate (ECAR, center) and spare respiratory capacity (SRC, right) from two donors. Graphs show the mean ± s.d. of each timepoint (left) or three representative timepoints (center, right) within each donor. c, 1-way ANOVA with Dunnett’s multiple comparison’s test; d, 2-way ANOVA or Mixed-effects model with Dunnett’s multiple comparison’s test; g unpaired two-sided student’s T test. *, P < 0.05; **, P < 0.01; ***, P < 0.001; ****, P < 0.0001.

