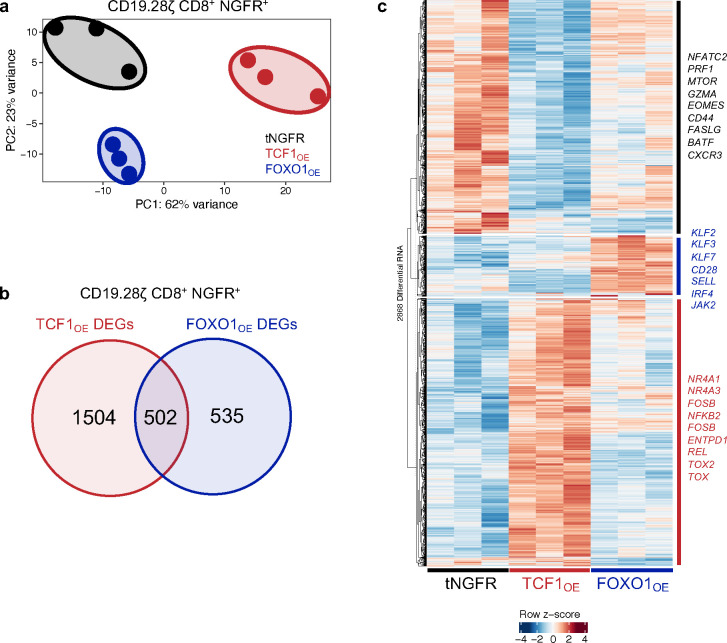
Extended Data Figure 4: FOXO1 or TCF1 overexpression induces transcriptional reprogramming in CD19.28ζ CAR T cells.
a-c, Bulk RNA sequencing analyses of day 15 tNGFR-purified CD8+ CD19.28ζ CAR T cells overexpressing tNGFR (black), TCF1 (red), or FOXO1 (blue) (n = 3 donors). a, Unbiased principal component analysis (PCA). b, Venn diagram showing the number of unique and shared differentially expressed genes (DEGs) in TCF1OE and FOXO1OE cells compared to tNGFR cells (adjusted P < 0.05 with log2(fold change) 0.5). c, Heatmap and hierarchical clustering of DEGs. Genes of interest are demarcated and colored based on the condition in which they’re upregulated.

