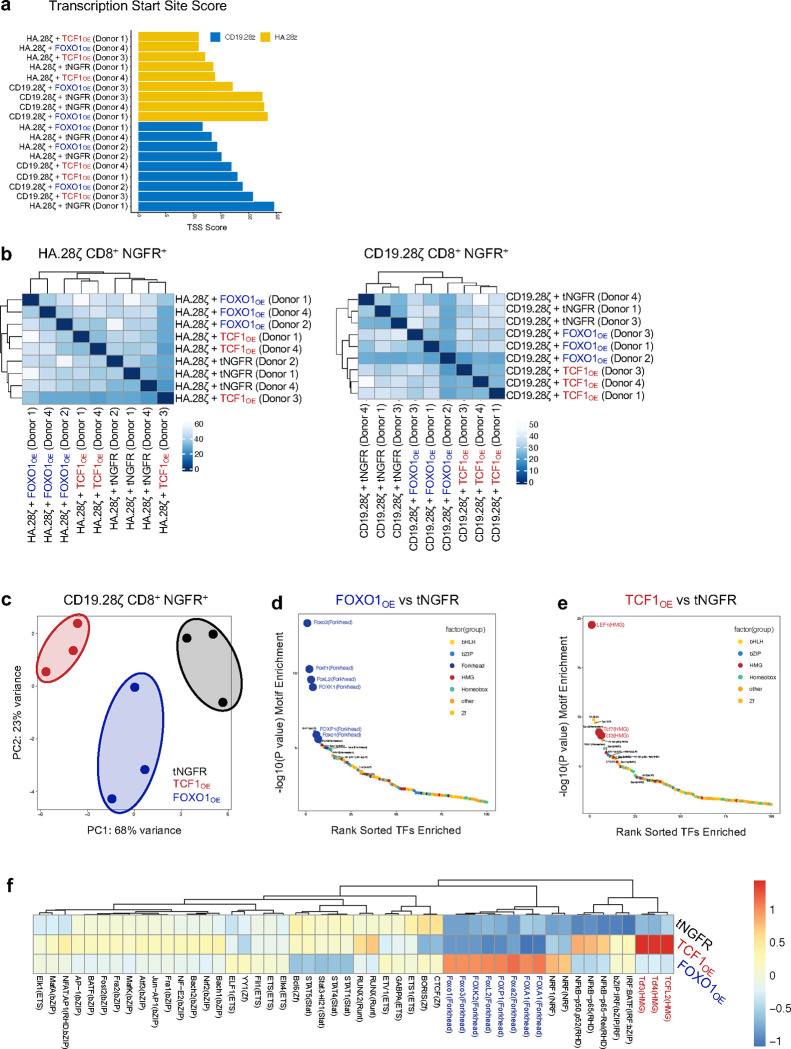
Extended Data Figure 5: FOXO1 and TCF1 overexpression induce chromatin remodeling in HA.28ζ and CD19.28ζ CAR T cells.
a, Transcriptional start site (TSS) enrichment scores for all samples. b, Pearson correlation and hierarchical clustering of ATAC-sequencing data. c-f, Bulk ATAC-seq analyses of day 15 tNGFR-purified, CD8+ CD19.28ζ CAR T cells overexpressing tNGFR (black), TCF1 (red) or FOXO1 (blue) (n = 3 independent donors). c, Principal component analysis (PCA). d,e, Rank ordered plot of differentially accessible transcription factor binding motifs in FOXO1OE cells (d) and TCF1OE cells (e) versus tNGFR controls. Transcription factor families are annotated by color. f, Heatmap and hierarchical clustering of mean differential motif accessibility. Scale shows normalized z-scores for each motif.

