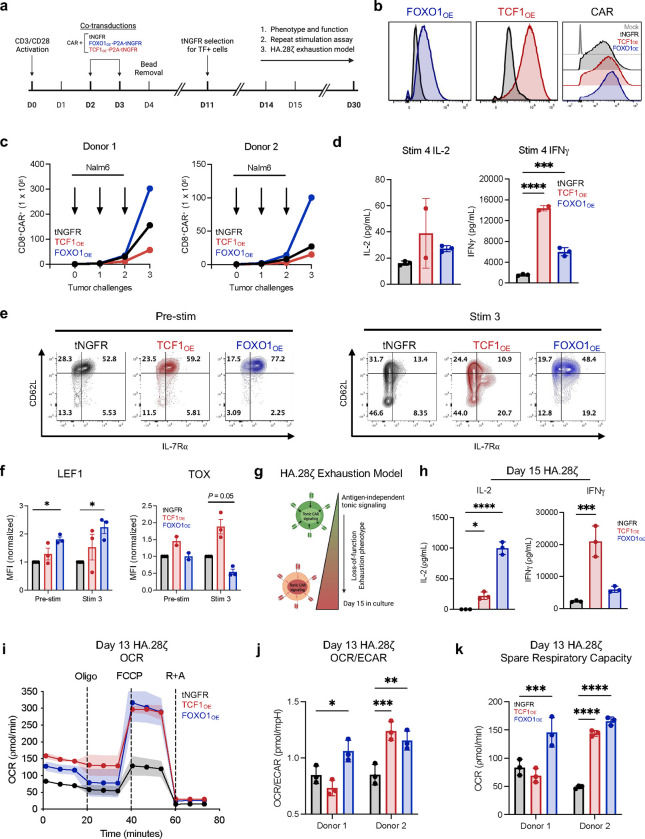
Figure 2: Overexpression of FOXO1 in CAR T cells promotes a memory phenotype, antitumor activity, and metabolic fitness during chronic stimulation.
a, Schematic depicting engineering of truncated NGFR-only (tNGFR), TCF1/tNGFR- (TCF1OE), and FOXO1/tNGFR- (FOXO1OE) overexpressing CAR T cells and magnetic isolation of tNGFR positive cells for downstream analyses. b, Flow cytometric analysis confirming transcription factor overexpression in TCF1OE (red) and FOXO1OE (blue) compared to tNGFR (black) (left), and CD19.28ζ CAR expression across groups compared to untransduced cells (Mock, gray) (right). c-f, tNGFR-purified CD8+ CD19.BBζ CAR T cells overexpressing FOXO1 (blue), TCF1 (red), or tNGFR (black) were repeatedly challenged with Nalm6 at a 1:4 effector:target ratio. c, CD8+ T cell expansion measured 72h after each challenge (n = 2 donors). d, IL-2 and IFNγ secretion after the fourth tumor challenge (mean ± s.d. of 2–3 wells from 1 representative donor, n = 2 donors). e,f, Flow cytometric analysis of memory- and exhaustion-associated markers at baseline and 7 days after the third tumor challenge. Contour plots show a representative donor and bar graphs show mean ± s.e.m. of MFI normalized to tNGFR levels within each donor (n = 2–4 donors from 3 independent experiments). g, CAR T cell exhaustion model15,24 whereby T cells express a high-affinity GD2-targeting CAR (HA.28ζ) that promotes antigen-independent tonic CAR signaling for 15 days. h, Day 15 IL-2 and IFNγ secretion from HA.28ζ CAR T cells overexpressing tNGFR (black), TCF1 (red), or FOXO1 (blue) in response to 143B osteosarcoma cells. Plots show mean ± s.d. of 3 wells from 1 representative donor (n = 4 donors) i-k, Seahorse analysis was performed on tNGFR-purified HA.28ζ CAR T cells overexpressing tNGFR (black), TCF1 (red), or FOXO1 (blue) (n = 2 donors). i, Oxygen consumption rate (OCR) before and after treatment with oligomycin (Oligo), FCCP, and rotenone and antimycin (R+A). Plot shows mean ± s.d. from 11 technical replicates from one representative donor. j, Ratio of OCR to extracellular acidification rate (ECAR). k, Spare respiratory capacity. j,k, Bar graphs show mean ± s.d. of three representative time points within each donor. d, 1-way ANOVA with Dunnett multiple comparisons test. f,h-k, 2-way ANOVA with Dunnett’s multiple comparisons test or Mixed-effects model with Dunnett’s multiple comparisons test. *, P < 0.05; **, P < 0.01; ***, P < 0.001; ****, P < 0.0001.

